Fig. 3
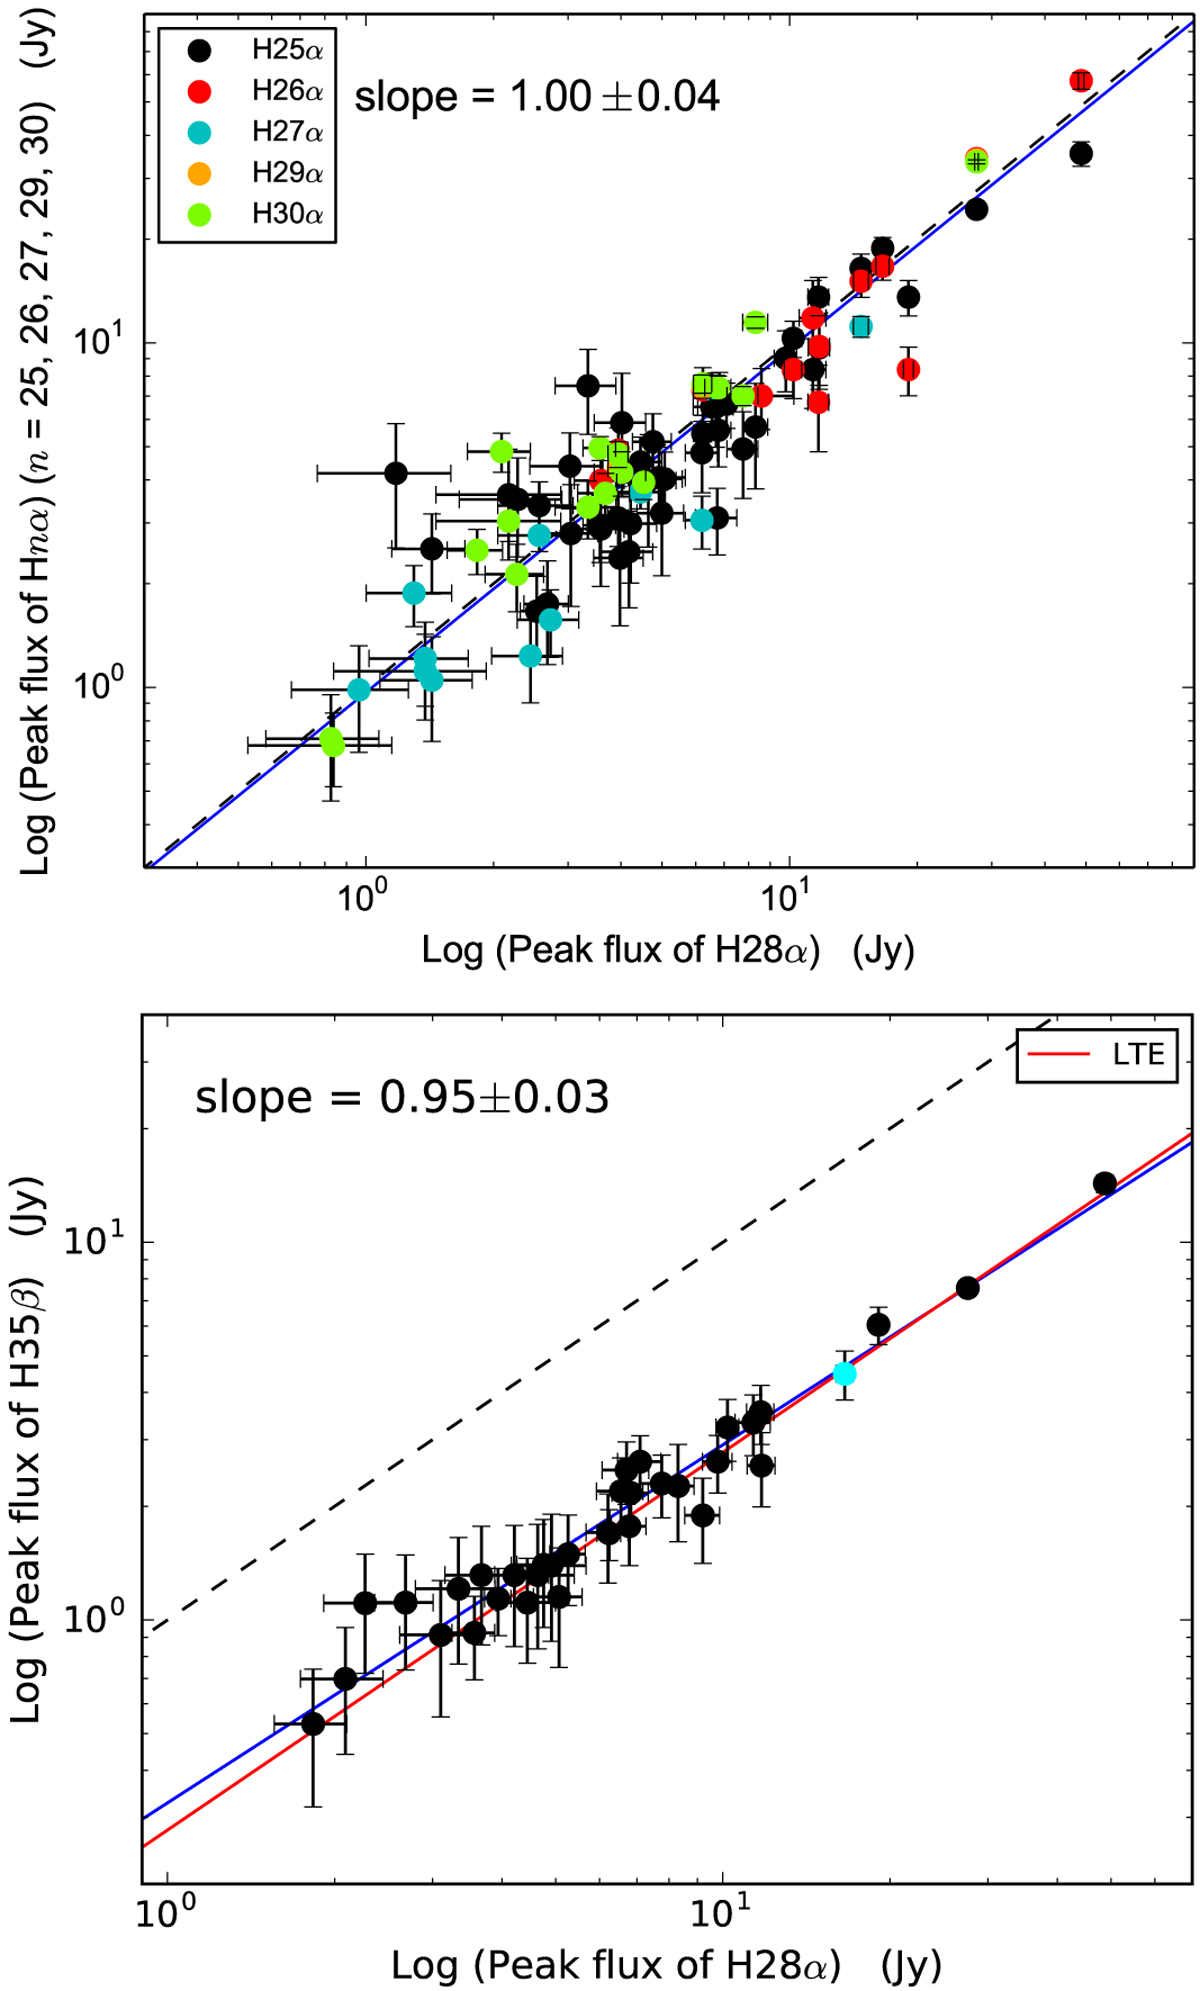
Upper panel: peak flux of the H28α transition versus peak flux of other transitions; H25α (black), H26α (red), H27α (cyan), H29α (orange), and H30α (bright green). All the plotted sources are detected in the H28α transition, and thus there are a few sources missing, which are only detected in other lines. Lower panel: peak flux of the H28α transition versus peak flux of H35β. In both plots, equal fluxes are indicated by the black dashed line, and blue lines indicate the best-fit determined by BCES bisector fits to all data points. The red line in the lower panel presents the predicted LTE value.
Current usage metrics show cumulative count of Article Views (full-text article views including HTML views, PDF and ePub downloads, according to the available data) and Abstracts Views on Vision4Press platform.
Data correspond to usage on the plateform after 2015. The current usage metrics is available 48-96 hours after online publication and is updated daily on week days.
Initial download of the metrics may take a while.