Fig. 11
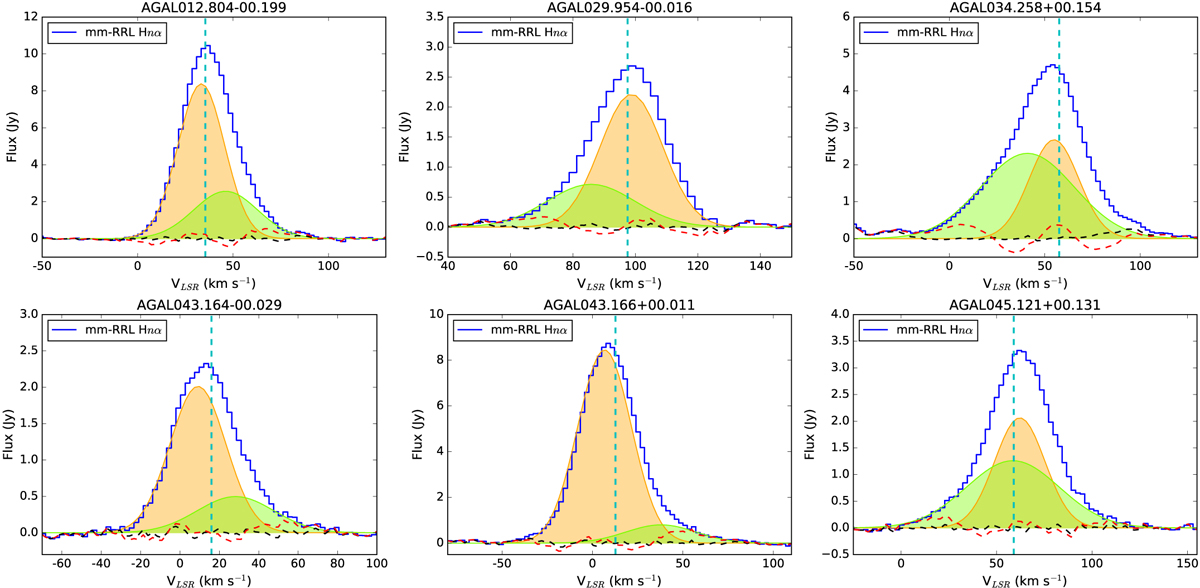
Green and yellow filled areas show two Gaussian fitted profiles of the Hnα transition. The back dashed line is a residual noise signal of the two Gaussian profiles. On the other hand, the red dashed line indicates a residual noise from a one-component Gaussian fit to the data. The vertical cyan dashed line shows the systemic velocity of the clump measured by H13 CO+ (1−0).
Current usage metrics show cumulative count of Article Views (full-text article views including HTML views, PDF and ePub downloads, according to the available data) and Abstracts Views on Vision4Press platform.
Data correspond to usage on the plateform after 2015. The current usage metrics is available 48-96 hours after online publication and is updated daily on week days.
Initial download of the metrics may take a while.