Free Access
Fig. 6.
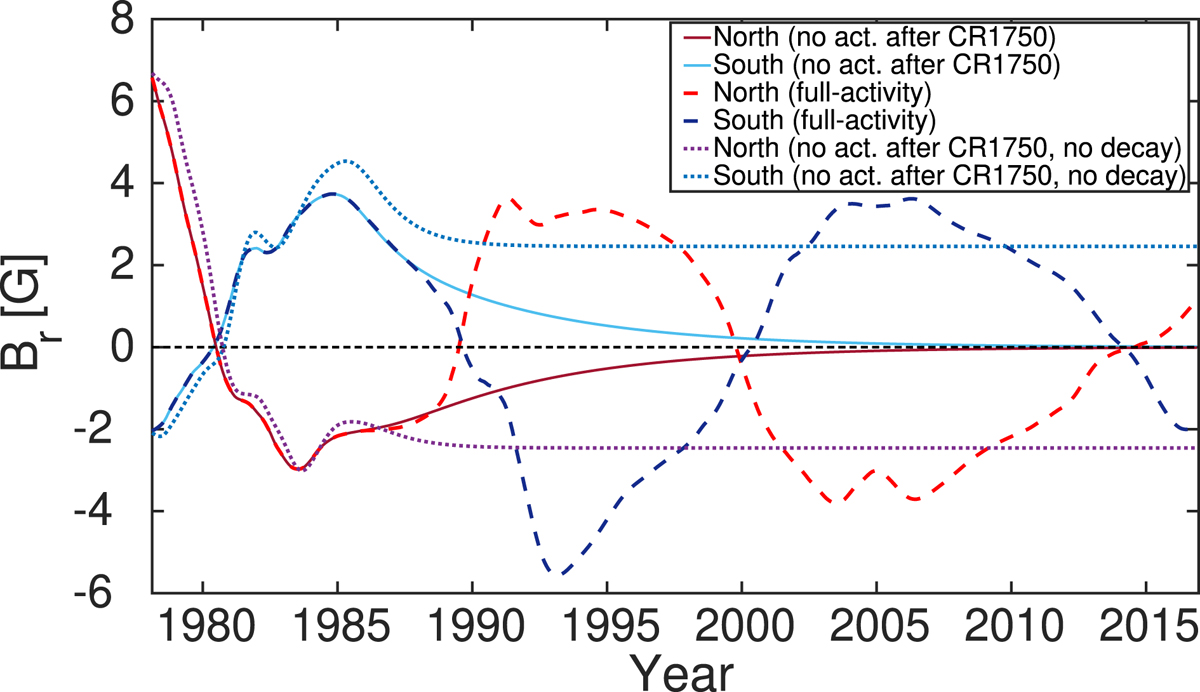
Average field strength above 60° and below −60° latitude from February 1978 (CR 1665) to December 2016 (CR 2184) in a full-activity simulation (dashed lines), in a no-activity simulation (solid lines) that does not include emerging flux after CR 1750, and in a no-activity simulation without the decay term (dotted lines).
Current usage metrics show cumulative count of Article Views (full-text article views including HTML views, PDF and ePub downloads, according to the available data) and Abstracts Views on Vision4Press platform.
Data correspond to usage on the plateform after 2015. The current usage metrics is available 48-96 hours after online publication and is updated daily on week days.
Initial download of the metrics may take a while.