Fig. 7.
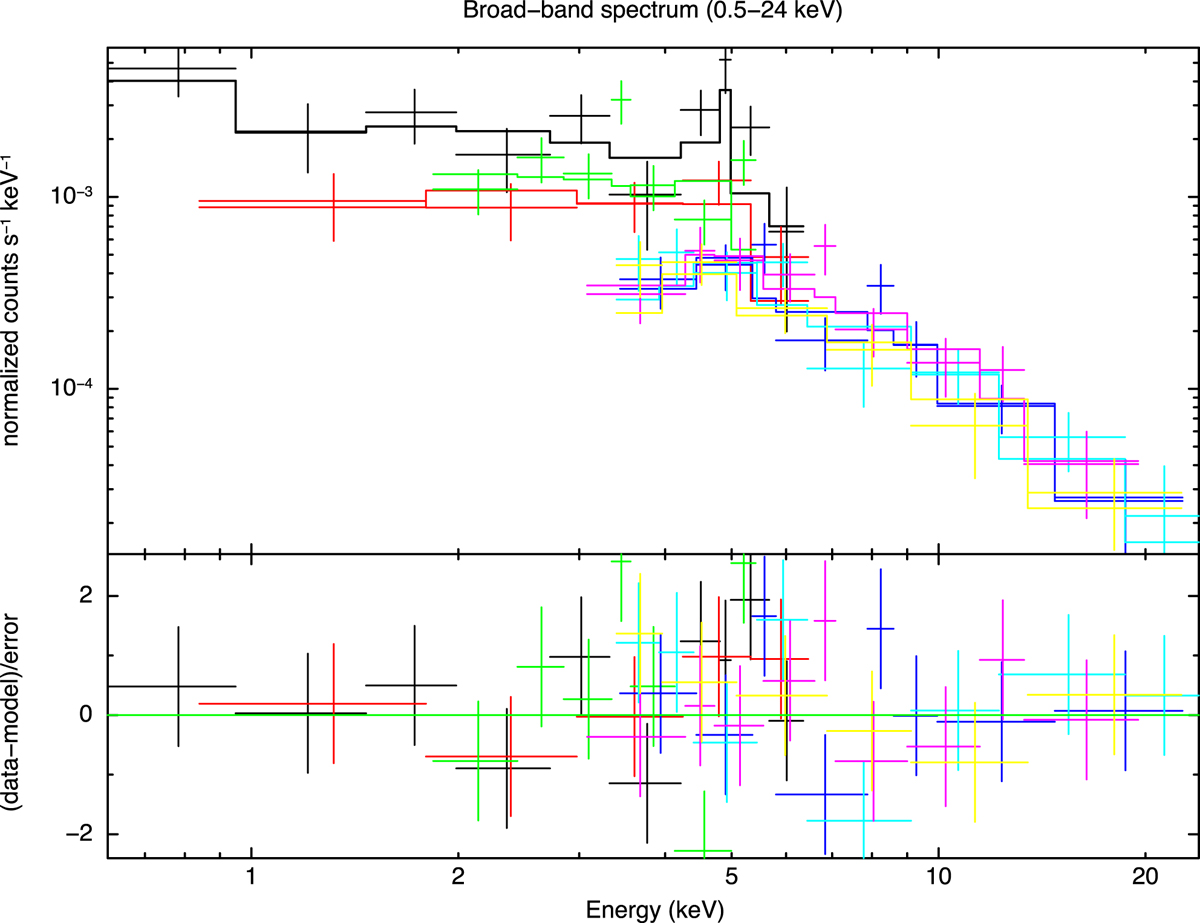
I00183 Chandra, XMM-Newton, and NuSTAR spectra folded through the instrumental response with the model superimposed in the observed energy frame 0.5–24 keV. All the spectra are grouped by 15 counts per bin and further re-binned for presentation purposes. The model consists of X ILLVER for the ionized reflection, and a transmission through a neutral medium. The spectrum below 2 keV was modelled using a simple power law, and a Gaussian component was added to account for the expected neutral iron line at 6.4 keV (fixed). The bottom panel shows the residual between the data and the model in terms of σ. Legend: black and red refer to the XMM EPIC cameras (pn and the coadded MOS1-MOS2); green refers to Chandra; and light blue, purple, cyan, and yellow refer to the two FPMA and FPMB NuSTAR detectors, respectively.
Current usage metrics show cumulative count of Article Views (full-text article views including HTML views, PDF and ePub downloads, according to the available data) and Abstracts Views on Vision4Press platform.
Data correspond to usage on the plateform after 2015. The current usage metrics is available 48-96 hours after online publication and is updated daily on week days.
Initial download of the metrics may take a while.