Fig. 6.
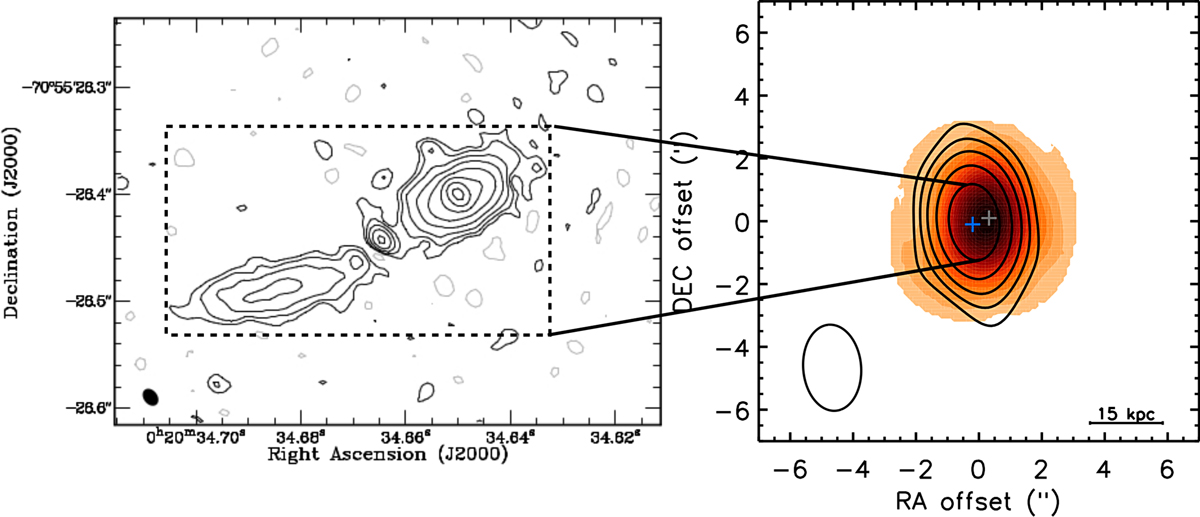
VLBI map of I00183 at 2.3 GHz (left panel) adapted from Norris et al. (2012) and ALMA CO integrated intensity (moment 0) with the underlying 87 GHz continuum contours superimposed (right panel). Contours are drawn at 3,6,9, ... times the 1σ rms noise level of the continuum map (0.02 mJy−1). The white and blue crosses indicate the position of the centre of ALMA CO and continuum emissions, respectively; the two positions are shifted by 0.53 arcsec ~2.5 kpc. The spatial extent of the region imaged by the VLBI observation is completely embedded into the ALMA continuum synthesized beam (shown in the bottom left corner of the right panel), but the orientation of the radio source seems to be consistent with the direction of the observed shift between the line and the continuum emission in ALMA Band 3.
Current usage metrics show cumulative count of Article Views (full-text article views including HTML views, PDF and ePub downloads, according to the available data) and Abstracts Views on Vision4Press platform.
Data correspond to usage on the plateform after 2015. The current usage metrics is available 48-96 hours after online publication and is updated daily on week days.
Initial download of the metrics may take a while.