Free Access
Fig. 5.
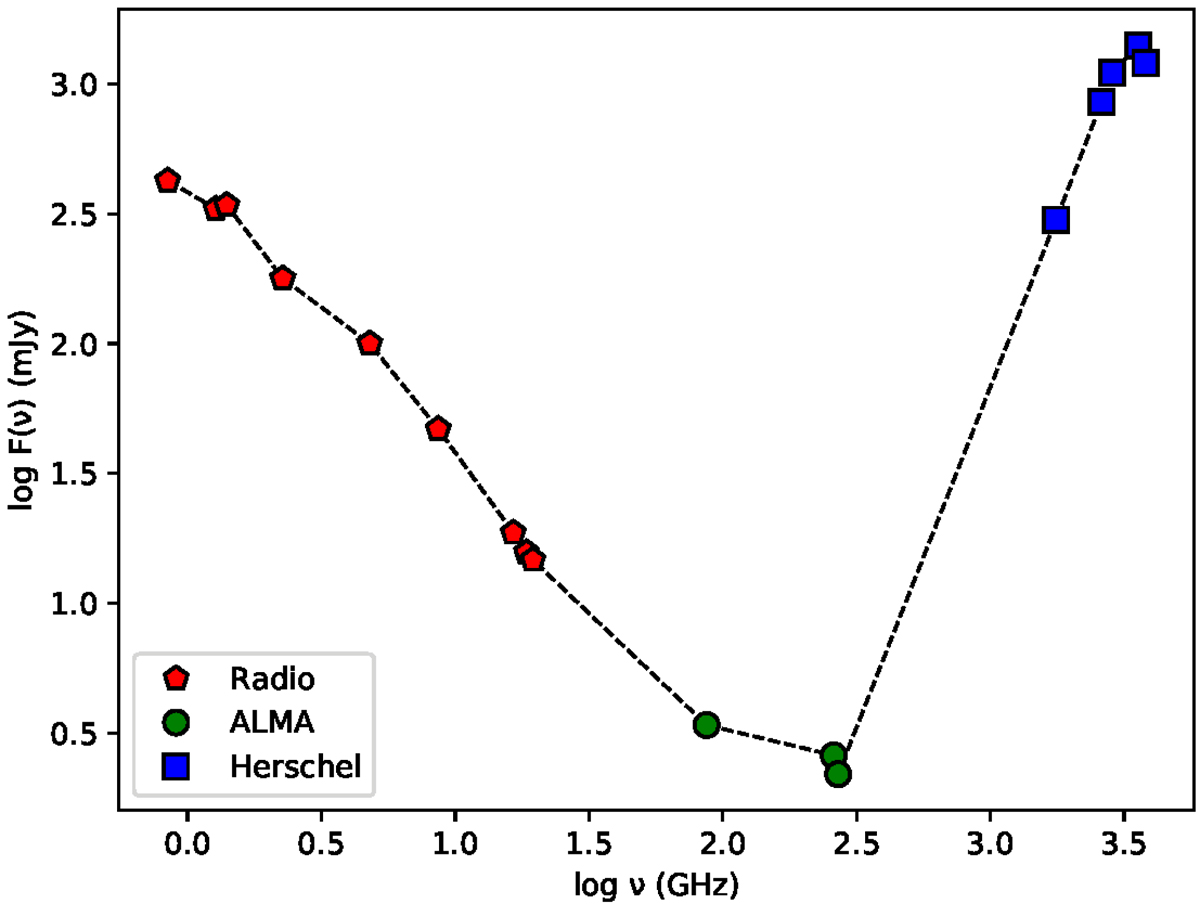
Radio/infrared spectral energy distribution of I00183 with the observed frequencies in the lower axis. The radio, ALMA, and farinfrared flux densities are from Norris et al. (2012), this work, and the archival Herschel observations, respectively, and are indicated by red pentagons, green circles, and blue squares.
Current usage metrics show cumulative count of Article Views (full-text article views including HTML views, PDF and ePub downloads, according to the available data) and Abstracts Views on Vision4Press platform.
Data correspond to usage on the plateform after 2015. The current usage metrics is available 48-96 hours after online publication and is updated daily on week days.
Initial download of the metrics may take a while.