Fig. 4.
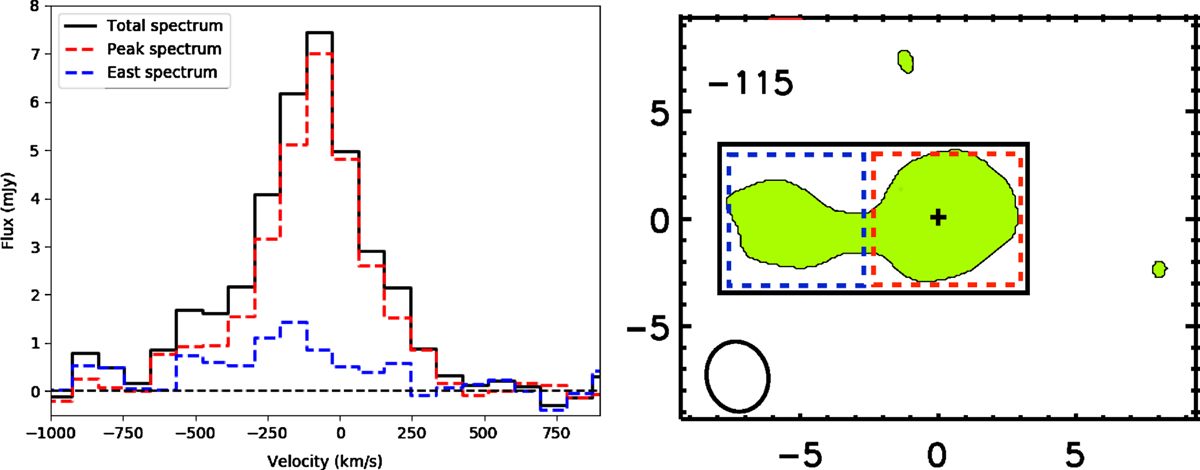
Integrated CO spectral profiles (left panel) extracted from the CO data cube within the regions highlighted in the right panel. By superimposing the three spectra it becomes clear that the spectra around the peak and those around the eastern protrusion give their contribution to the blueshifted excess of the total integrated spectrum. Moreover, the peak of the emission extended eastward at −115 km s−1 (right panel) is indistinguishable in the total spectrum because of its proximity to the central line peak. Observations with higher spectral and spatial resolution would be needed to better investigate the observed features.
Current usage metrics show cumulative count of Article Views (full-text article views including HTML views, PDF and ePub downloads, according to the available data) and Abstracts Views on Vision4Press platform.
Data correspond to usage on the plateform after 2015. The current usage metrics is available 48-96 hours after online publication and is updated daily on week days.
Initial download of the metrics may take a while.