Fig. 3.
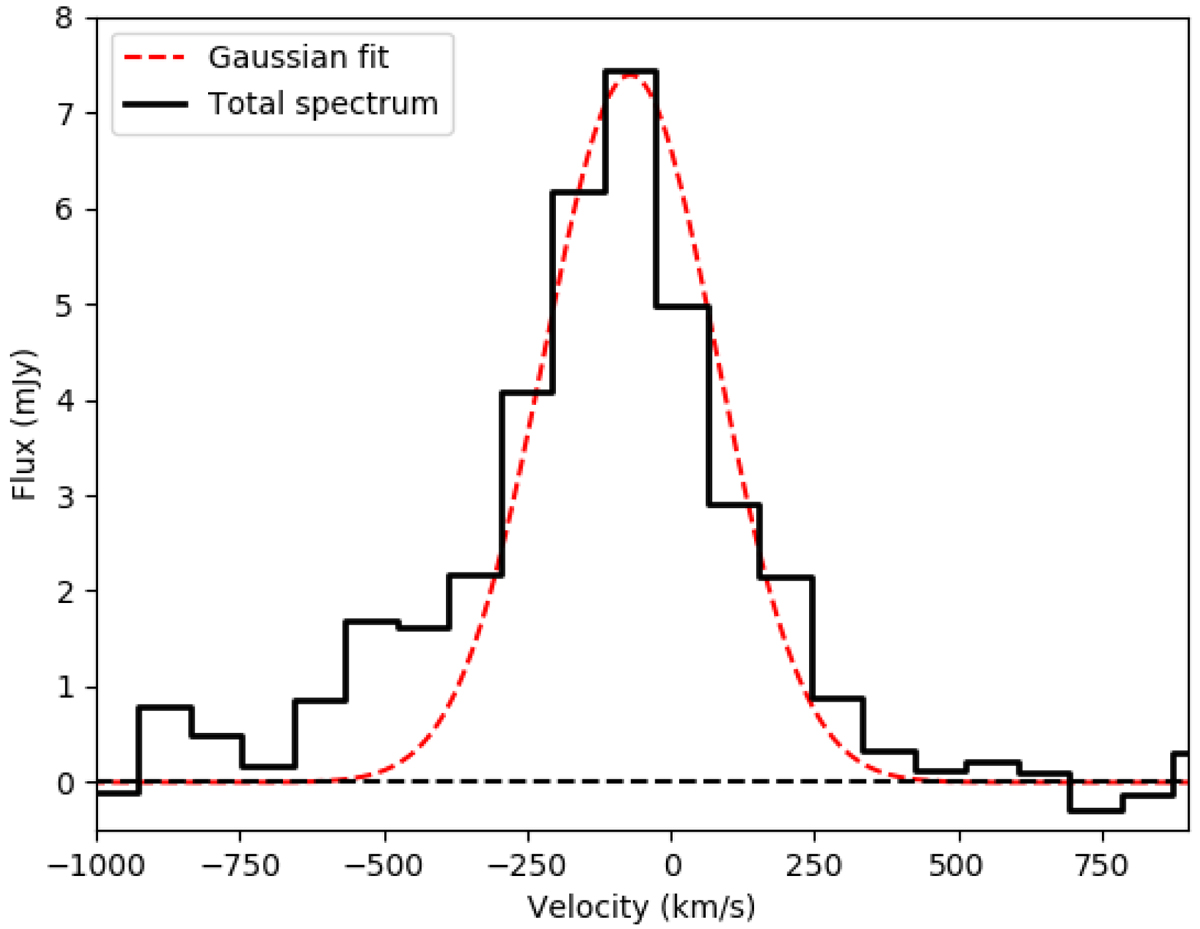
Spectral profiles of the CO(1-0) line emission (black) with its Gaussian fit superimposed (red). The lower axis indicates the velocity in km s−1 relative to the line centre at z = 0.327. The dashed horizontal line in black indicates the zero flux level. The line profile has a FWHM of ~400 ± 27 km s−1 and shows a broader and blueshifted wing, which is clearly residual with respect to the Gaussian shape. This could be considered an indication of the presence of an outflow from the CO emitting region, but the spectral resolution is too low (90 km s−1) to draw solid conclusions.
Current usage metrics show cumulative count of Article Views (full-text article views including HTML views, PDF and ePub downloads, according to the available data) and Abstracts Views on Vision4Press platform.
Data correspond to usage on the plateform after 2015. The current usage metrics is available 48-96 hours after online publication and is updated daily on week days.
Initial download of the metrics may take a while.