Fig. 2.
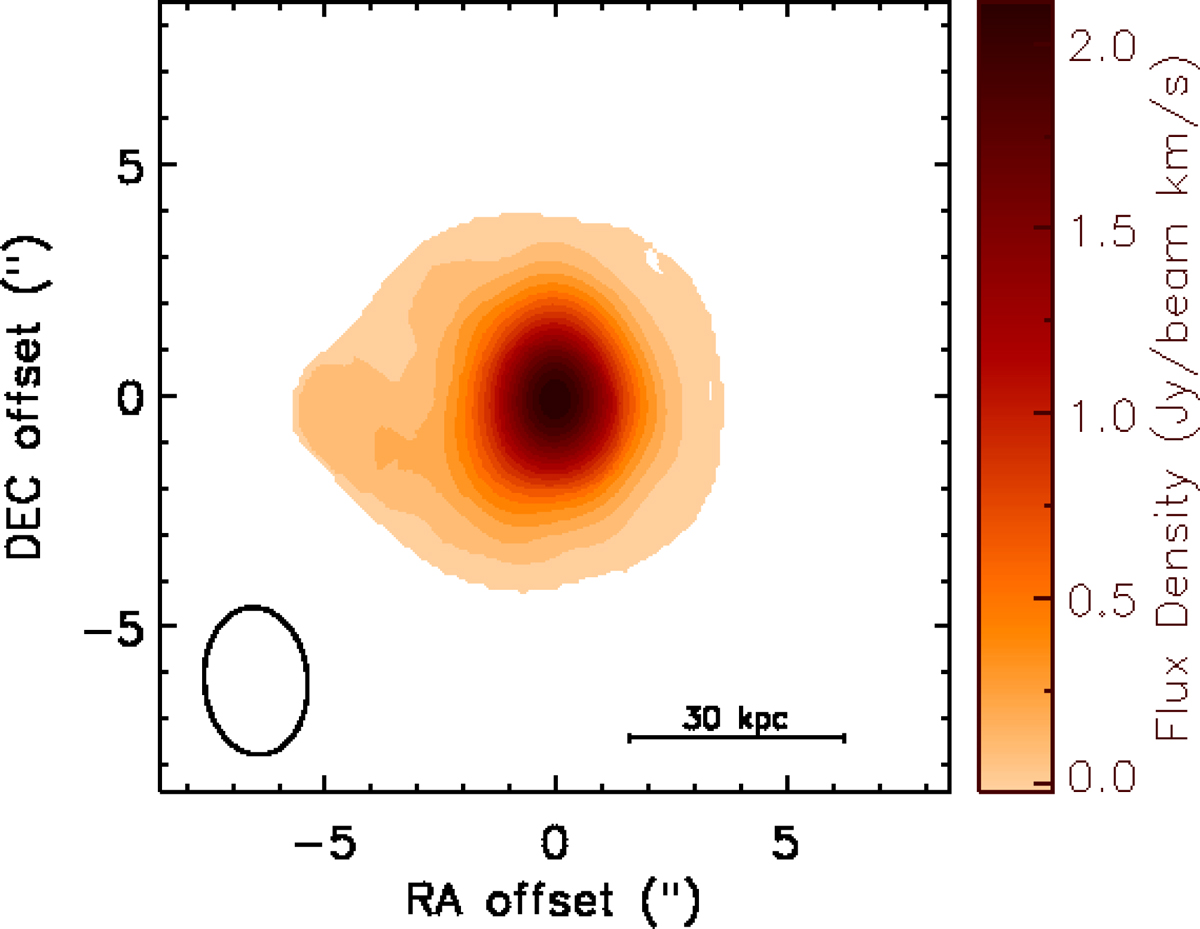
CO integrated intensity map (moment 0) created using the masked moment technique described in Sect. 4. The synthesized beam size is shown in the bottom left corner of the panel. The wedge on the right shows the colour-scale of the map in Jy beam−1 km s−1. After performing a 2D Gaussian fit within the region containing the CO emission, we estimated the source size of (1.63 ± 0.25) × (1.09 ± 0.51) arcsec2 (deconvolved from beam), corresponding to (7.8 ± 1.2) × (5.2 ± 2.4) kpc2. The integrated flux density is 2.56 ± 0.26 Jy km s−1.
Current usage metrics show cumulative count of Article Views (full-text article views including HTML views, PDF and ePub downloads, according to the available data) and Abstracts Views on Vision4Press platform.
Data correspond to usage on the plateform after 2015. The current usage metrics is available 48-96 hours after online publication and is updated daily on week days.
Initial download of the metrics may take a while.