Fig. 1.
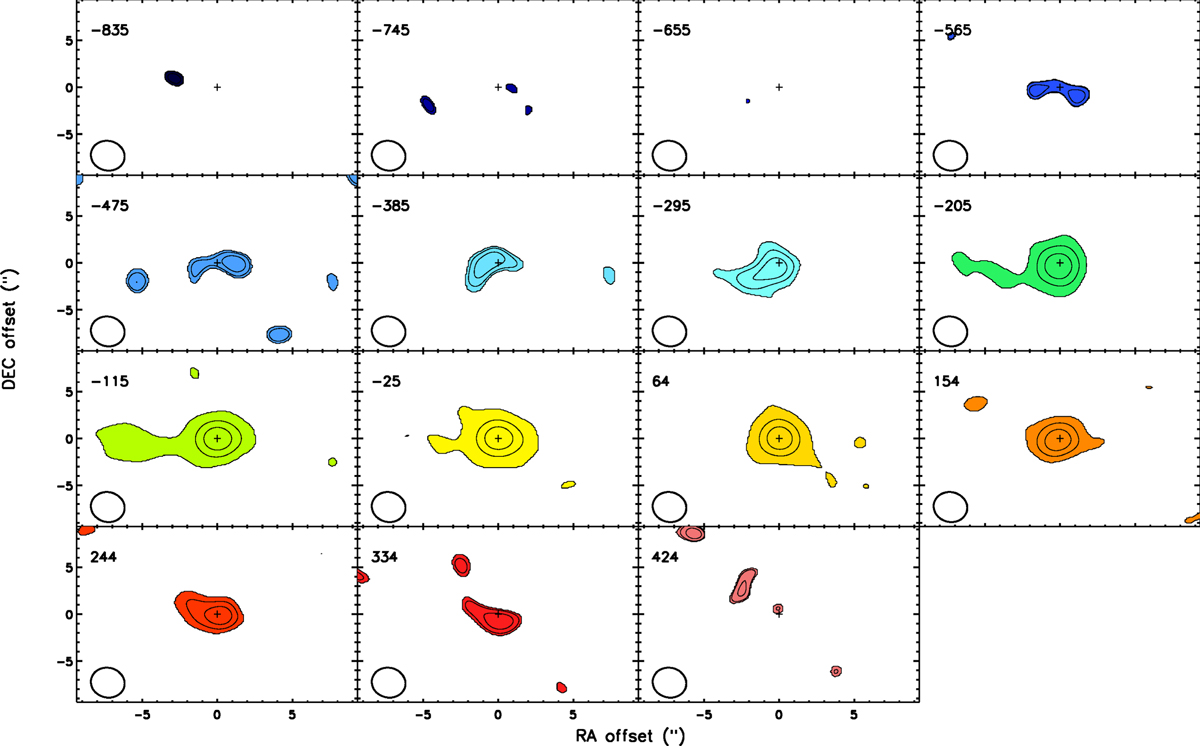
Channel map of the 12CO(1-0) line in the velocity range where the emission is detected, clipped to the 2.5σ rms noise level. The corresponding velocity of each channel (in km s−1) is labelled in the top left corner. The synthesized beam size is plotted in the bottom left corner of each panel. Different colours are used to plot the emission in different channels. Contour levels are drawn at 2.5σ intervals. RA and Dec offset are measured with respect to the image phase centre, highlighted by the black cross. East is to the left and north is to the top.
Current usage metrics show cumulative count of Article Views (full-text article views including HTML views, PDF and ePub downloads, according to the available data) and Abstracts Views on Vision4Press platform.
Data correspond to usage on the plateform after 2015. The current usage metrics is available 48-96 hours after online publication and is updated daily on week days.
Initial download of the metrics may take a while.