Fig. 8
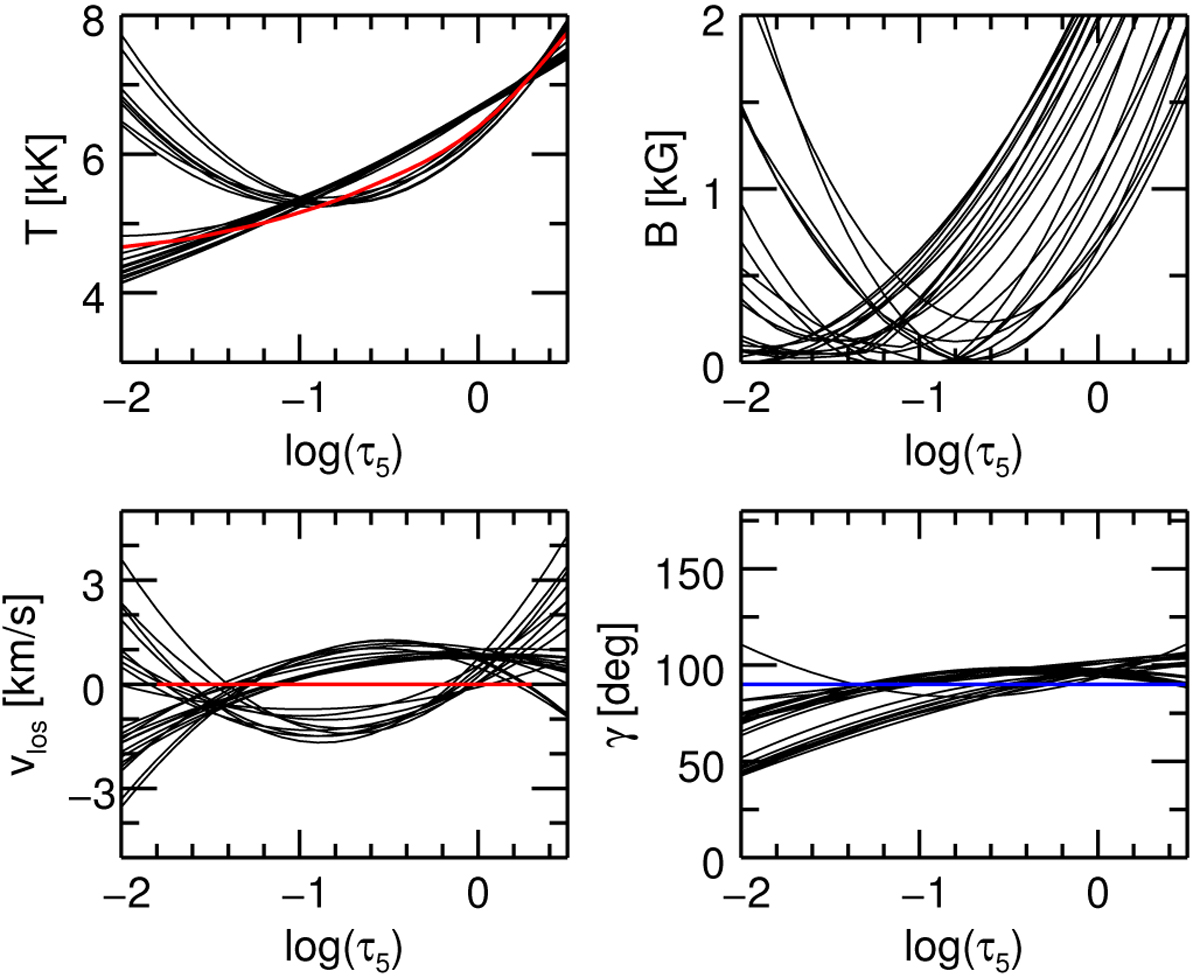
Results as a function of the logarithm of the optical depth (logτ5) for the one component inversion: temperature T (top-left), magnetic field strength B (top-right), line-of-sight velocity vlos (bottom-left), inclination of the magnetic field with respect to the observer’s line-of-sight γ (bottom-right). Individual black curves correspond to the inversion of individual pixels. The red curve on the top-left panels shows the temperature stratification from the HSRA model. Red/blue curves on the lower panels indicate vlos = 0 (bottom-left)and γ = 90° (i.e., horizontal magnetic field; bottom-right).
Current usage metrics show cumulative count of Article Views (full-text article views including HTML views, PDF and ePub downloads, according to the available data) and Abstracts Views on Vision4Press platform.
Data correspond to usage on the plateform after 2015. The current usage metrics is available 48-96 hours after online publication and is updated daily on week days.
Initial download of the metrics may take a while.