Fig. 7
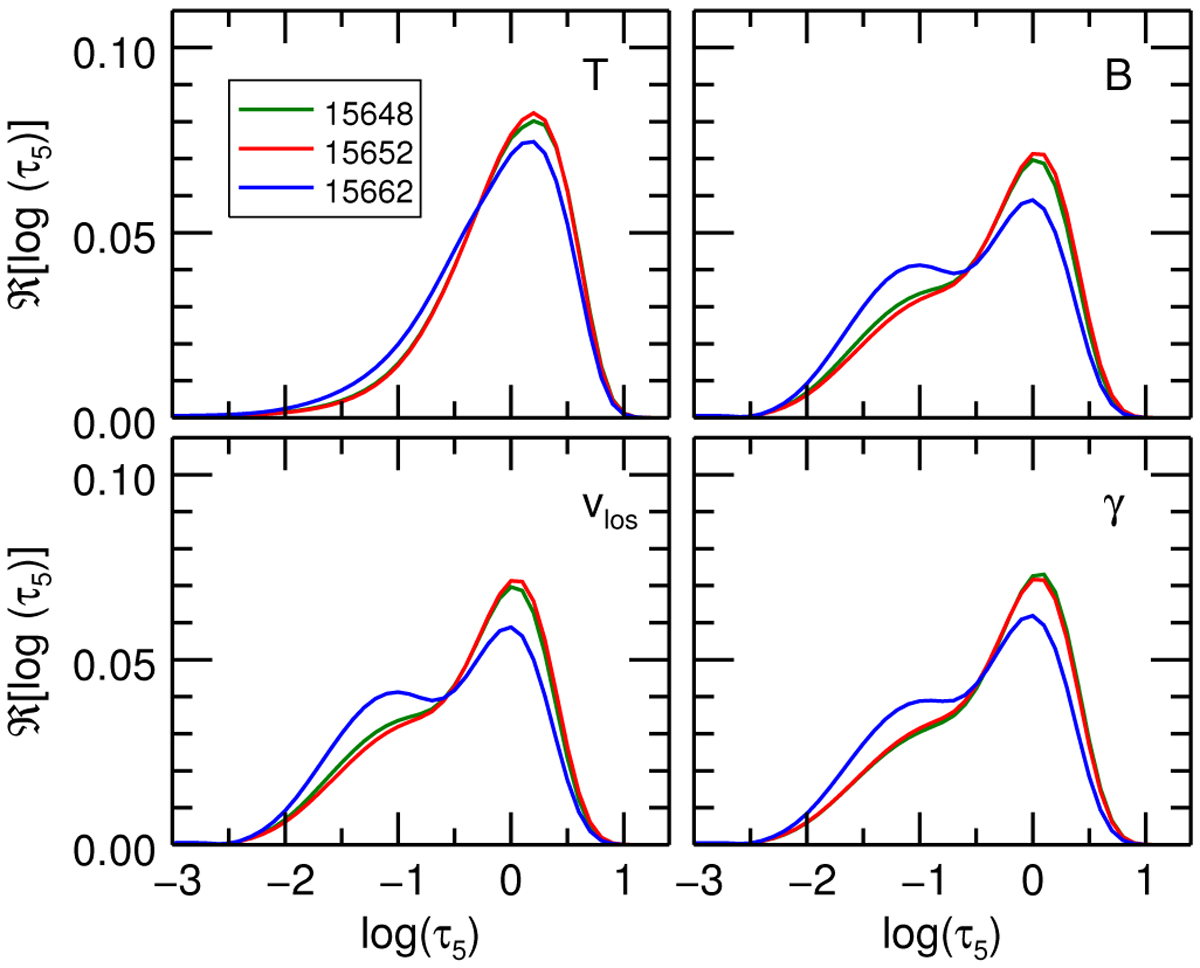
Response functions integrated over wavelength, added up for all four Stokes parameters and plotted as a function of the logarithm of the optical depth log τ5. Top-left: response to the temperature T. Top-right: response to the line-of-sight velocity vlos. Bottom-left: response to the magnetic field strength B. Bottom-right: response to the inclination of the magnetic field with respect to the observer’s line-of-sight γ. Different colors correspond to different spectral lines. Green: 15 648 Å, red: 15 652 Å, blue: 15 662 Å. The response functions are calculated with the atmosphere resulting from the two-component inversion shown in Fig. 6.
Current usage metrics show cumulative count of Article Views (full-text article views including HTML views, PDF and ePub downloads, according to the available data) and Abstracts Views on Vision4Press platform.
Data correspond to usage on the plateform after 2015. The current usage metrics is available 48-96 hours after online publication and is updated daily on week days.
Initial download of the metrics may take a while.