Fig. 3
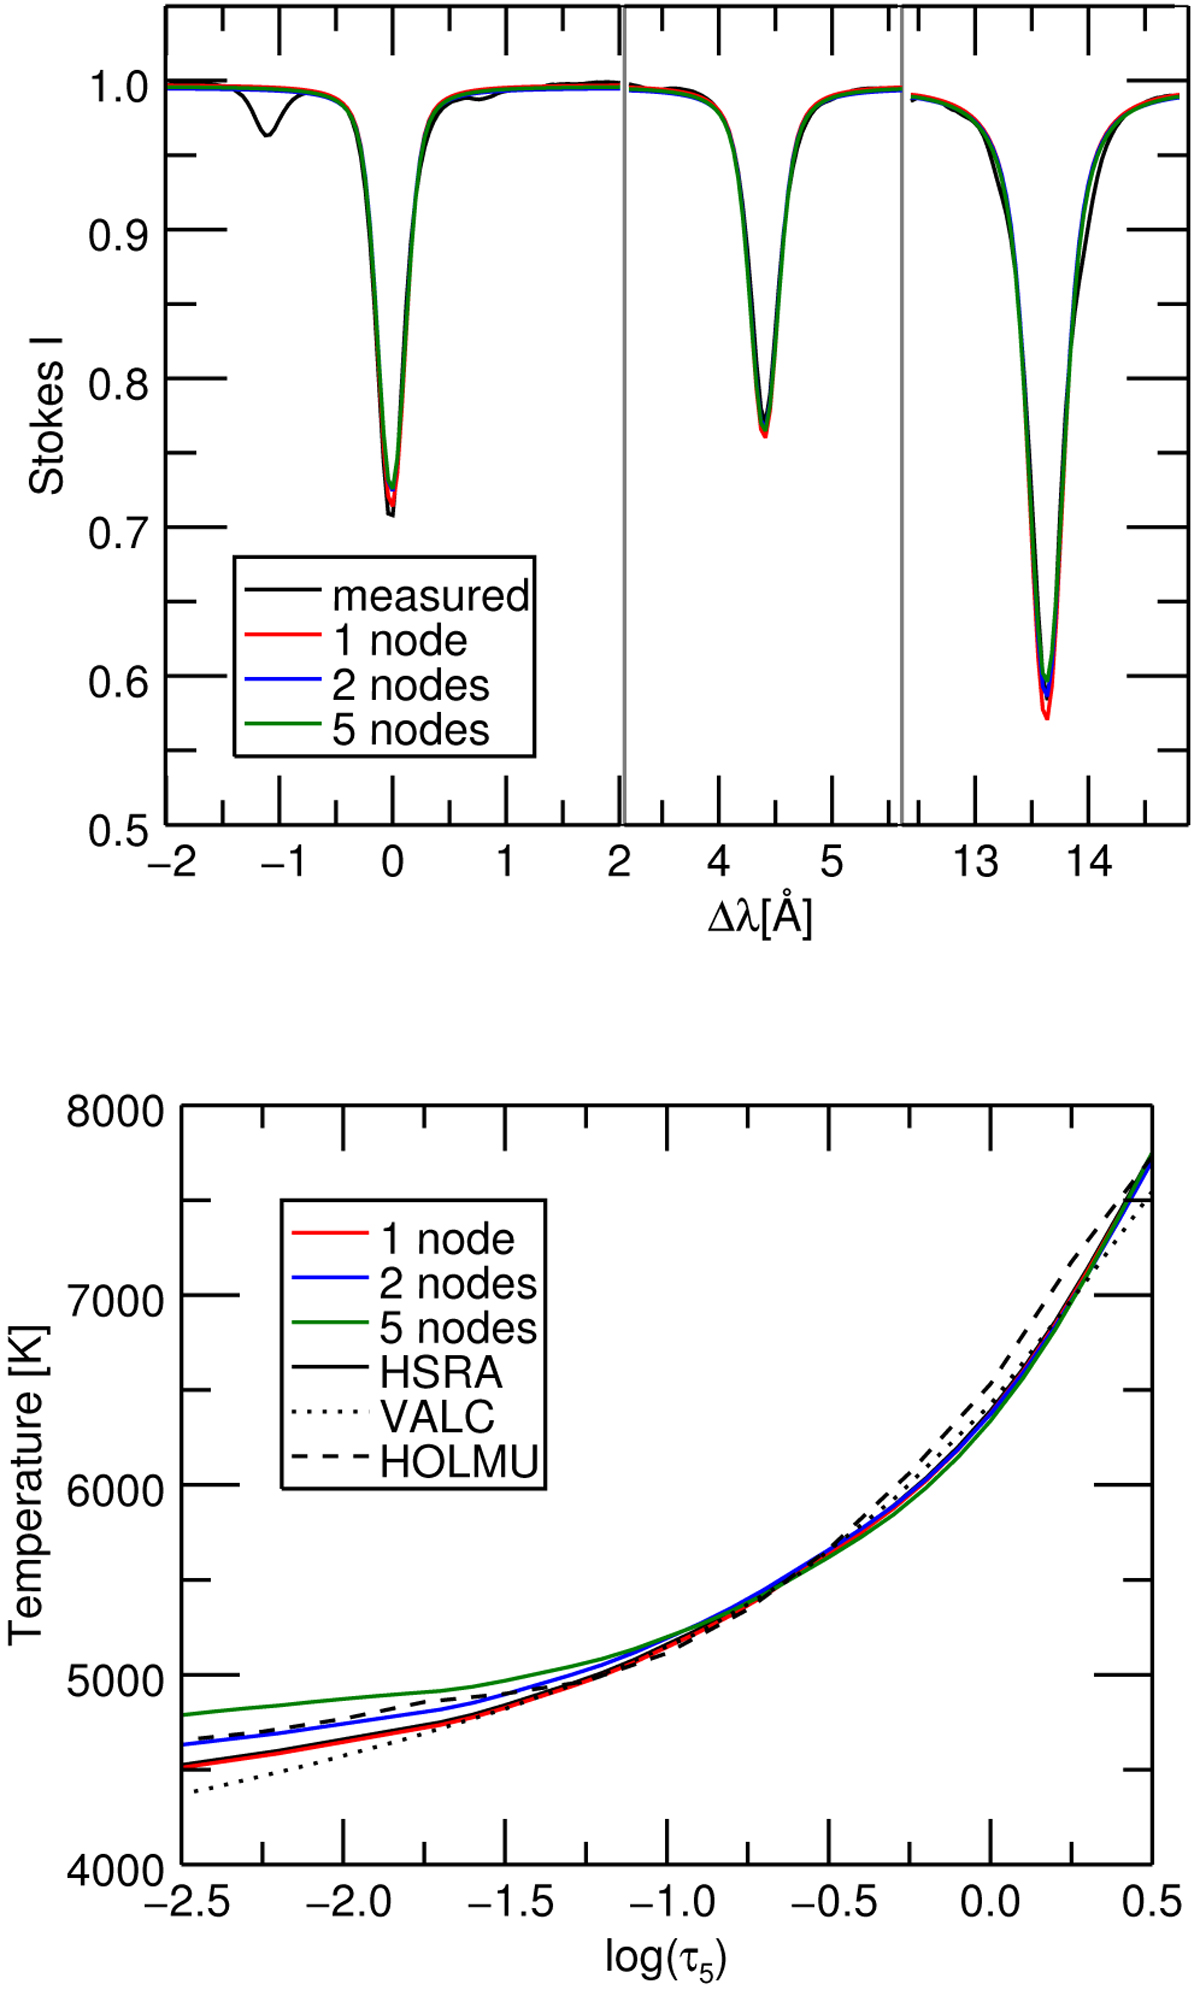
Calibration verification. All curves refer to the mean quiet Sun spectrum. Top panel: observed Stokes I (black) and best-fit profiles obtained with the SIR code and a varying number of nodes (red − 1−, blue − 2− and green −5−). Bottom panel: temperature stratification from the HSRA, VALC and HOLMU (black solid, dotted, and dashed lines, respectively). The color-code is the temperature inferred by the application of the SIR inversion code using a varying number of nodes as in the top panel.
Current usage metrics show cumulative count of Article Views (full-text article views including HTML views, PDF and ePub downloads, according to the available data) and Abstracts Views on Vision4Press platform.
Data correspond to usage on the plateform after 2015. The current usage metrics is available 48-96 hours after online publication and is updated daily on week days.
Initial download of the metrics may take a while.