Fig. 2
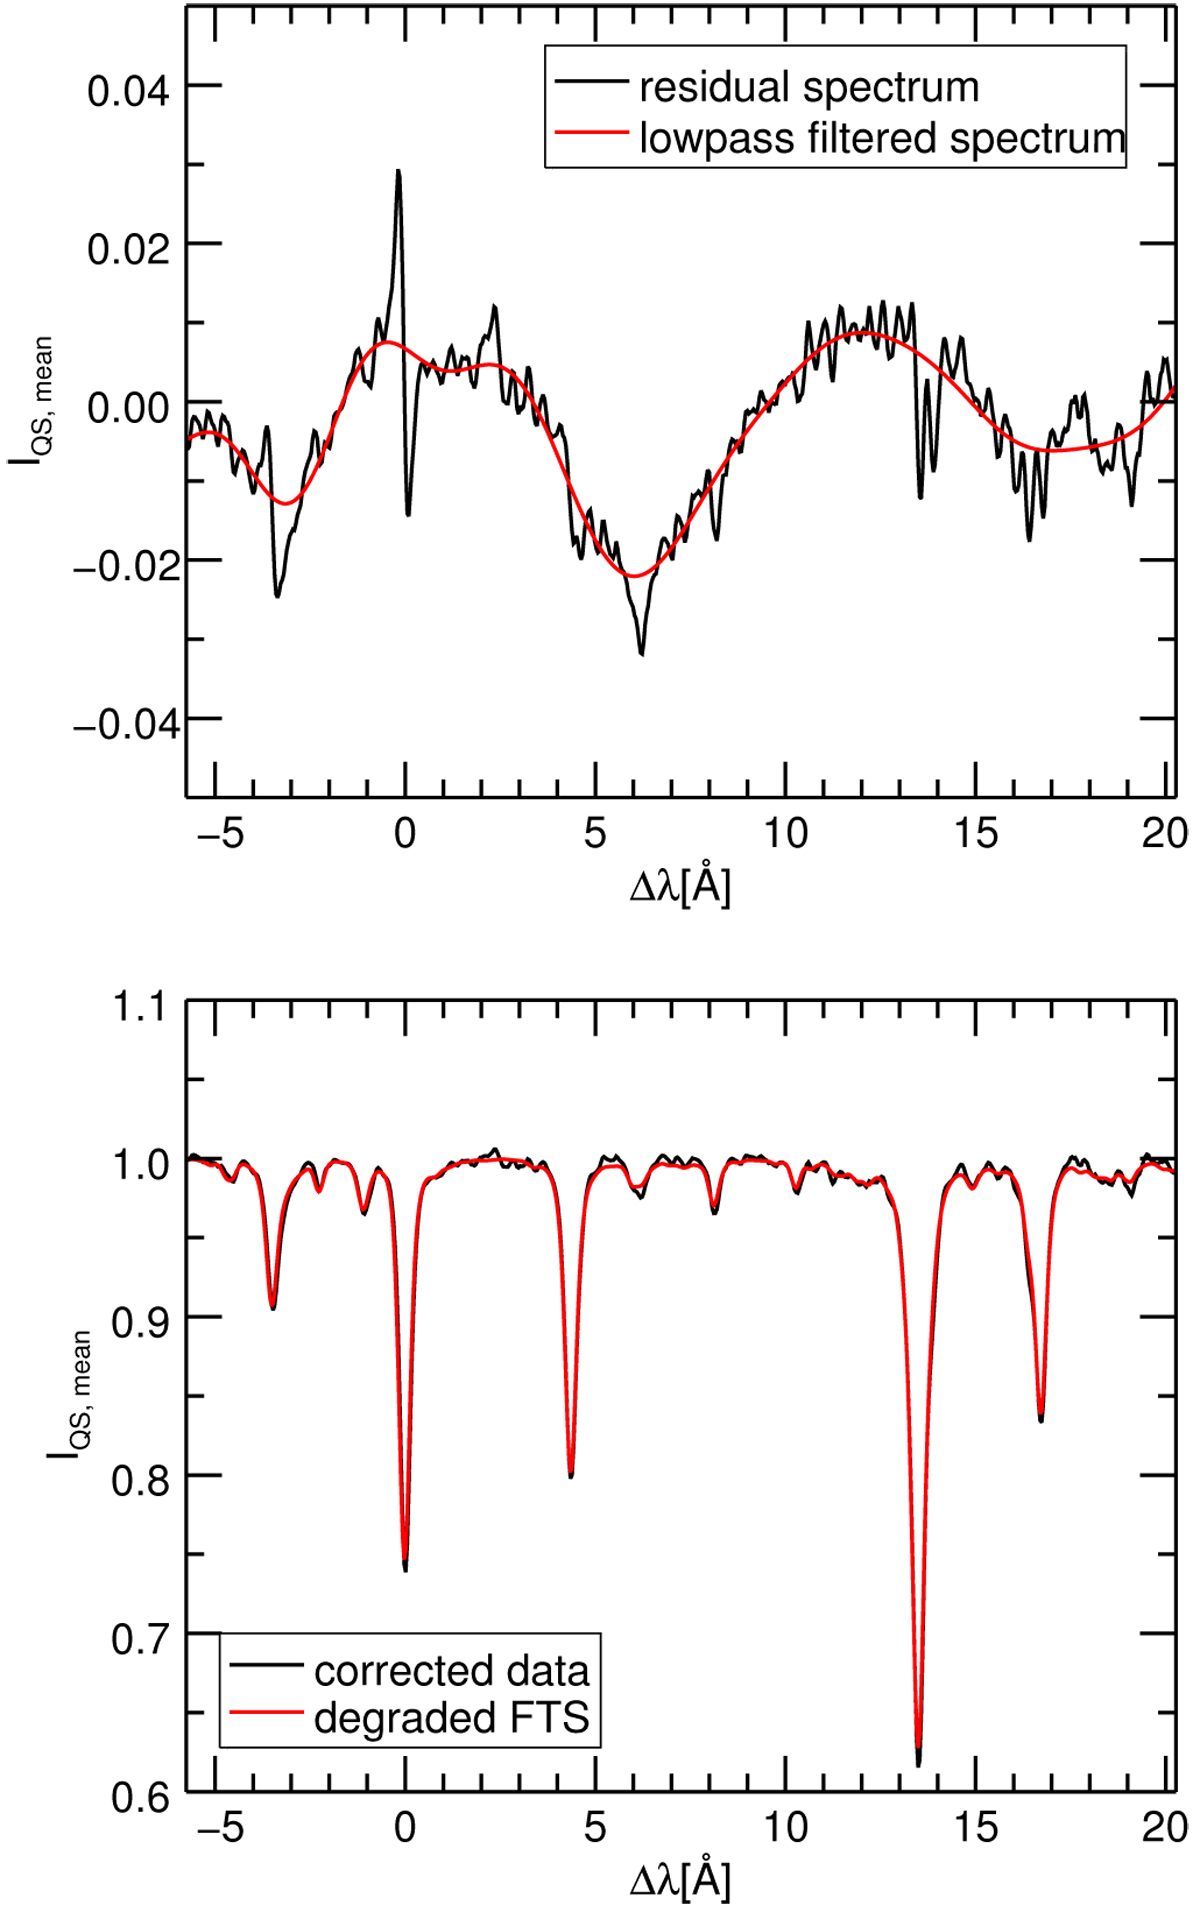
Continuum calibration using a comparison between the FTS spectrum and the measured spectrum. The top panel shows the residual spectrum (black) and the lowpass filtered curve used for the calibration (red). In the bottom panel we compare the degraded FTS spectrum (red) with the calibrated spectrum (black). Δ λ = 0 refers to theFe I 15 648.5 Å spectral line in Table 1.
Current usage metrics show cumulative count of Article Views (full-text article views including HTML views, PDF and ePub downloads, according to the available data) and Abstracts Views on Vision4Press platform.
Data correspond to usage on the plateform after 2015. The current usage metrics is available 48-96 hours after online publication and is updated daily on week days.
Initial download of the metrics may take a while.