Fig. 11
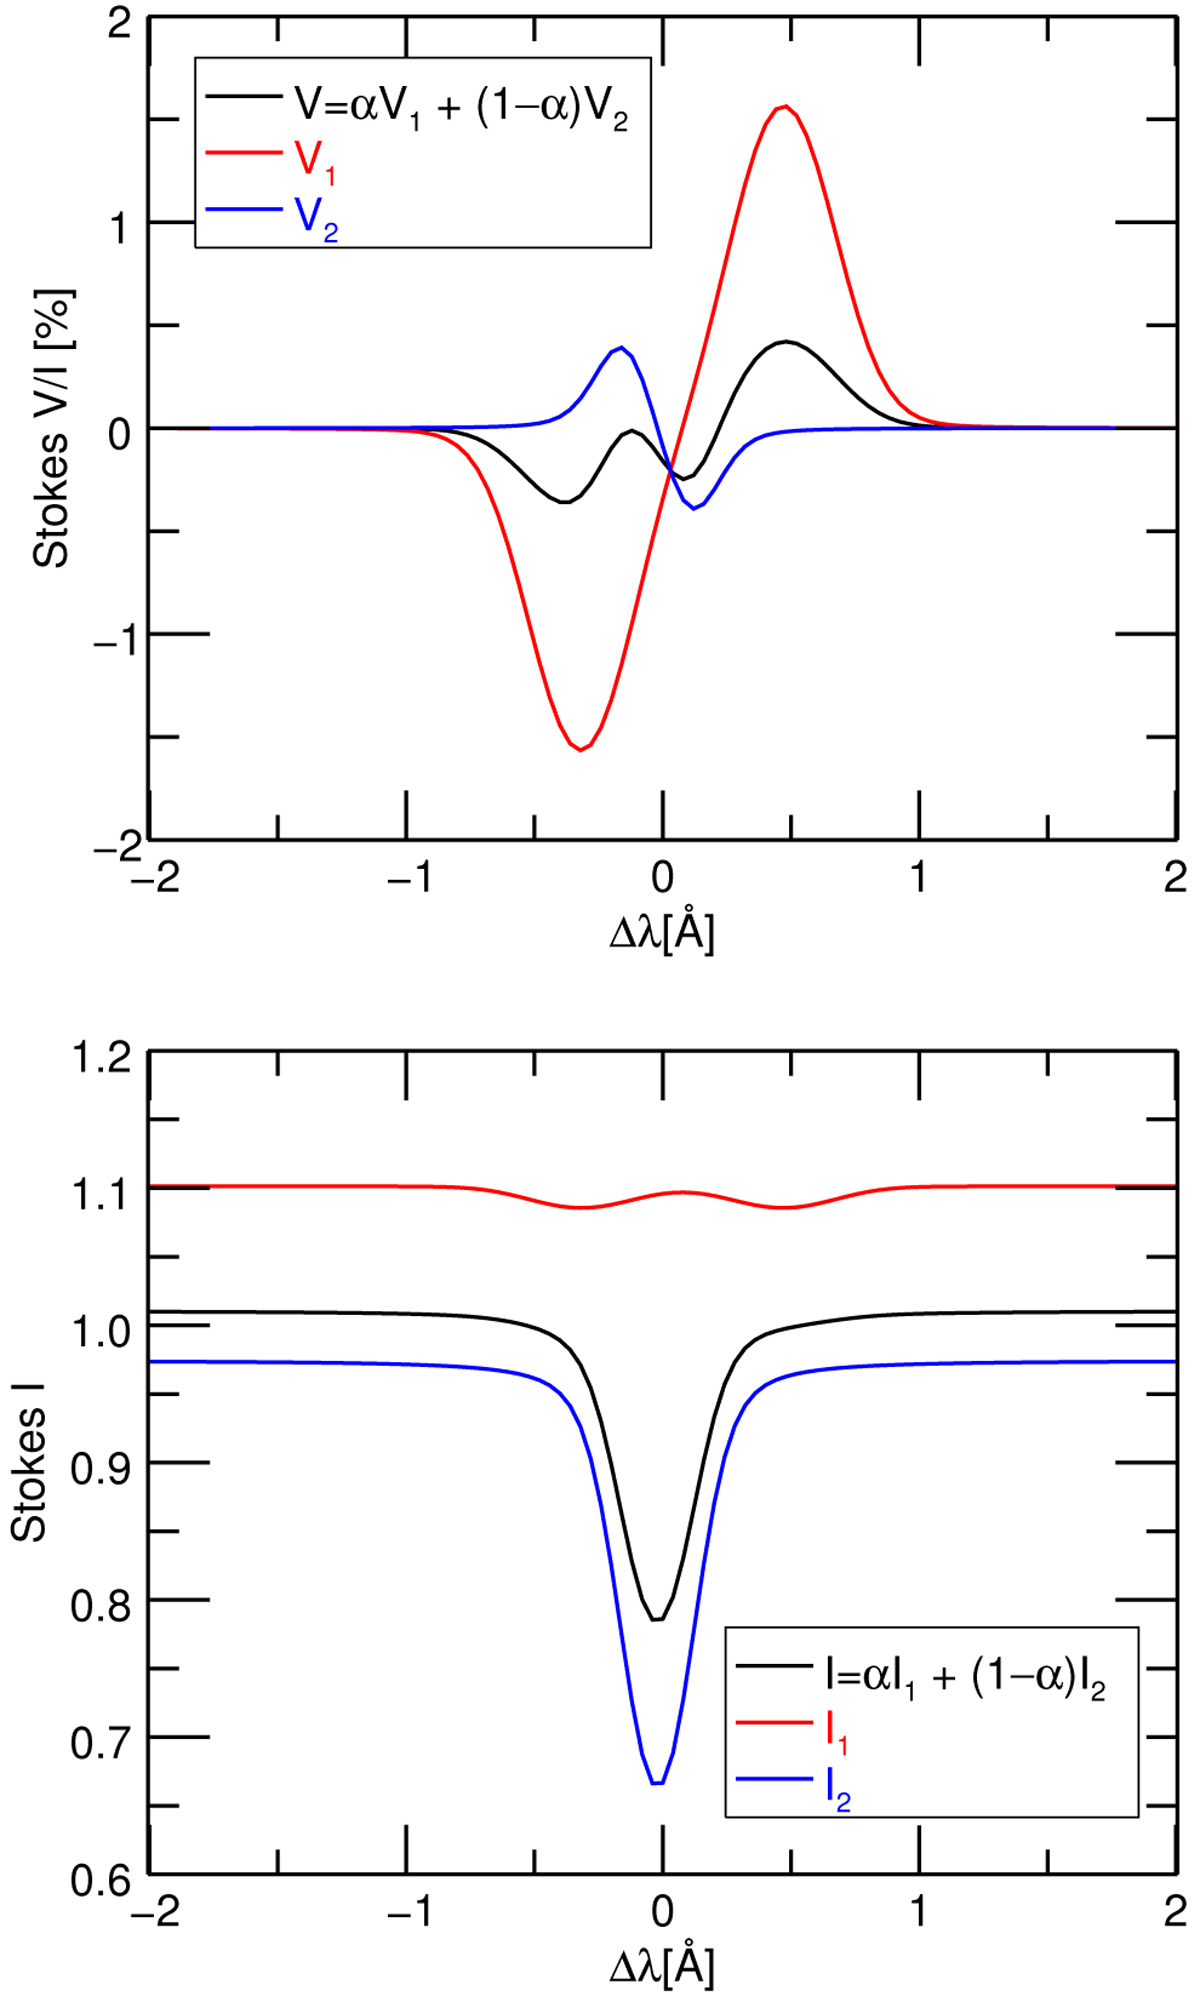
Comparison of synthetic Stokes V (upper panel) and I (lower panel) profiles of Fe I 15 648 Å in a two-component atmosphere. The black curve is the inversion result presented in Fig. 6. The red (blue) profile is caused by only the first (second) component, respectively. The respective magnetic field strengths are B = 1147 G and B = 9 G and the filling factor of the component with the strong magnetic field is α = 0.27. We note that both components produce circular polarization signals of similar amplitudes in spite of the very different magnetic fields. The final continuum intensity (lower panel) is about 1.0 (normalized to the quiet Sun value) in spite of the first component featuring very high temperatures (see red lines in the upper-left panel of Fig. 10).
Current usage metrics show cumulative count of Article Views (full-text article views including HTML views, PDF and ePub downloads, according to the available data) and Abstracts Views on Vision4Press platform.
Data correspond to usage on the plateform after 2015. The current usage metrics is available 48-96 hours after online publication and is updated daily on week days.
Initial download of the metrics may take a while.