Fig. 1
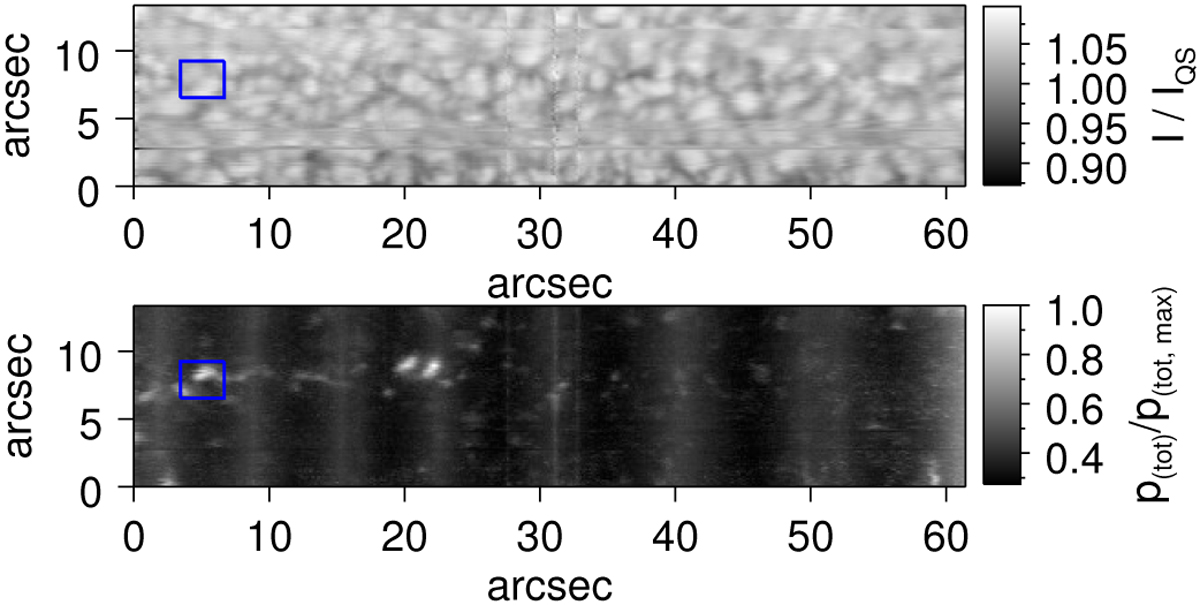
Upperpanel: continuum intensity (normalized to the average value over the field-of-view) of the scan used in this paper. Lower panel: total polarization normalized to its maximum. Scan direction is from bottom to top. The horizontal axis corresponds to the direction of the slit. The blue rectangle marks the area analyzed in this paper, also seen in Fig. 4 (top panel).
Current usage metrics show cumulative count of Article Views (full-text article views including HTML views, PDF and ePub downloads, according to the available data) and Abstracts Views on Vision4Press platform.
Data correspond to usage on the plateform after 2015. The current usage metrics is available 48-96 hours after online publication and is updated daily on week days.
Initial download of the metrics may take a while.