Fig. 2
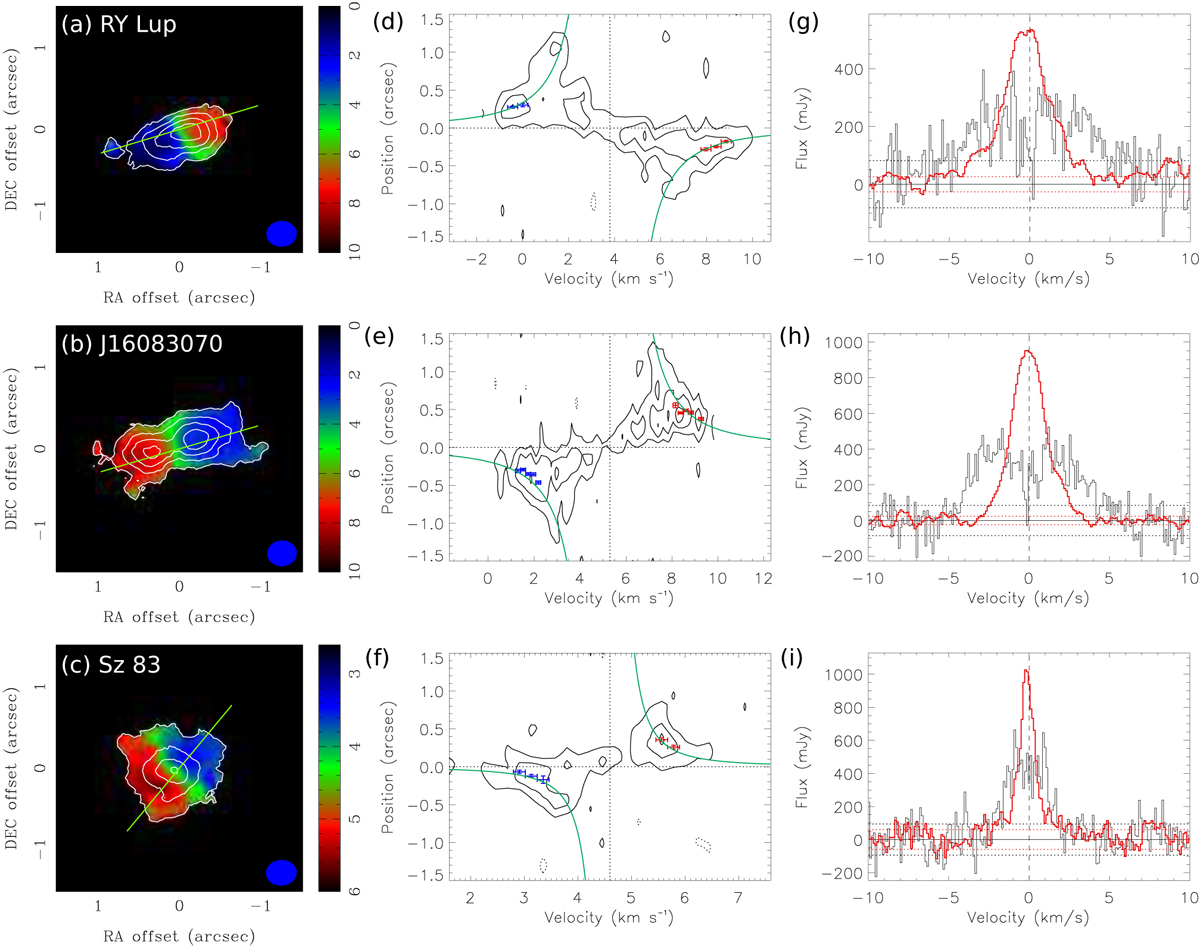
ALMA observational results of RY Lup (top row), J16083070−3828268 (middle row), and Sz 83 (bottom row). Panels a–c: moment 0 map (contour) overlaid on the moment 1 map (color; in units of km s−1) of the 13CO emission. Green lines denote the axes where the PV diagrams are extracted. Contour levels start from 3σ in steps of 3σ, where 1σ is 77 mJy km s−1 in panel a, 74 mJy km s−1 in panel b, and 44 mJy km s−1 in panel c. Panels d–f: PV diagrams of the 13CO emission along the major axes and passing through the stellar positions. Blue and red data points denote the measured peak positions in the high-velocity channels, and green curves present the fitted Keplerian rotational profiles to the data points. Contour levels start from 2σ in steps of 2σ, where 1σ is 35 mJy km s−1 in panel d and 50 mJy in panels e and f. Panels g–i: stacked 13CO spectra with (red) and without (black) alignment integrated over the disk area. Zero velocity refers to the measured Vsys. Red and black horizontal dotted lines denote ±1σ levels with and without alignment, respectively.
Current usage metrics show cumulative count of Article Views (full-text article views including HTML views, PDF and ePub downloads, according to the available data) and Abstracts Views on Vision4Press platform.
Data correspond to usage on the plateform after 2015. The current usage metrics is available 48-96 hours after online publication and is updated daily on week days.
Initial download of the metrics may take a while.