Fig. 1
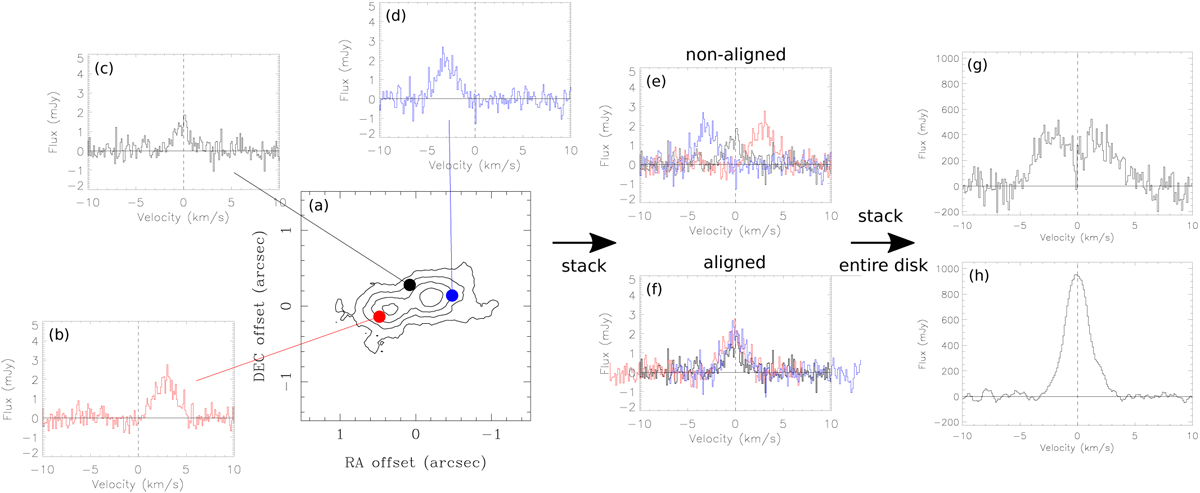
Demonstration of our method with the 13CO (3–2) data ofJ16083070−3828268. Panel a: moment 0 map of the 13CO (3–2) emission in J16083070−3828268 obtained with the ALMA observations. Panels b–d: 13CO Spectra at the same de-projected radius of 0.′′5 but at different position angles in the disk, shown as red, black, and blue dots in panel a. Panels e and f: demonstration of stacking the three spectra with and without aligning them with the Keplerian velocities at their positions in the disk. Panels g and h final stackedspectra integrated over the entire disk with and without the alignment.
Current usage metrics show cumulative count of Article Views (full-text article views including HTML views, PDF and ePub downloads, according to the available data) and Abstracts Views on Vision4Press platform.
Data correspond to usage on the plateform after 2015. The current usage metrics is available 48-96 hours after online publication and is updated daily on week days.
Initial download of the metrics may take a while.