Fig. 6
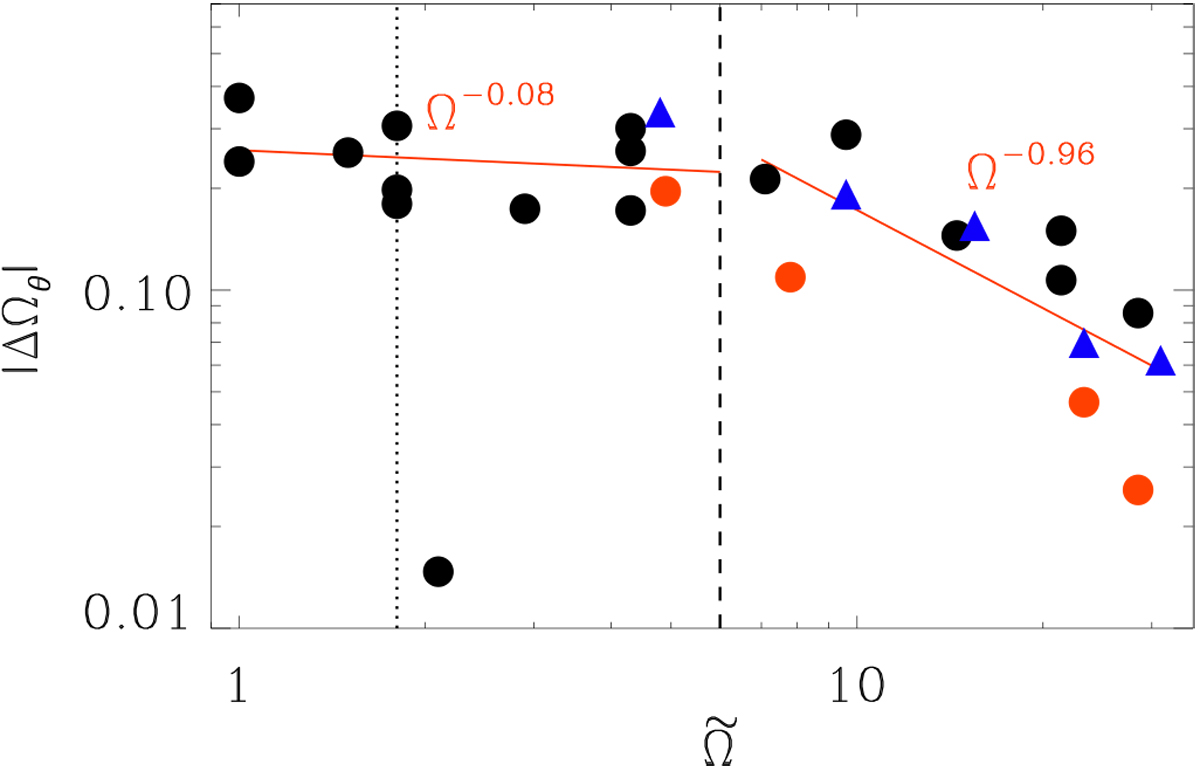
Modulus of the absolute latitudinal differential rotation, ![]() , normalized by the solar rotation rate, as a function of rotation rate. The red lines result from fitting. The black dashed line indicates the break in the slope. Red and black circles stand for high- and low-resolution 2π runs, respectively, while blue triangles show the π∕2 wedges. We note that for the fit for moderate rotation, we do not take into account Run D with very low values. The dotted line indicates the transition from antisolar to solar-like latitudinal differential rotation.
, normalized by the solar rotation rate, as a function of rotation rate. The red lines result from fitting. The black dashed line indicates the break in the slope. Red and black circles stand for high- and low-resolution 2π runs, respectively, while blue triangles show the π∕2 wedges. We note that for the fit for moderate rotation, we do not take into account Run D with very low values. The dotted line indicates the transition from antisolar to solar-like latitudinal differential rotation.
Current usage metrics show cumulative count of Article Views (full-text article views including HTML views, PDF and ePub downloads, according to the available data) and Abstracts Views on Vision4Press platform.
Data correspond to usage on the plateform after 2015. The current usage metrics is available 48-96 hours after online publication and is updated daily on week days.
Initial download of the metrics may take a while.