Fig. 2
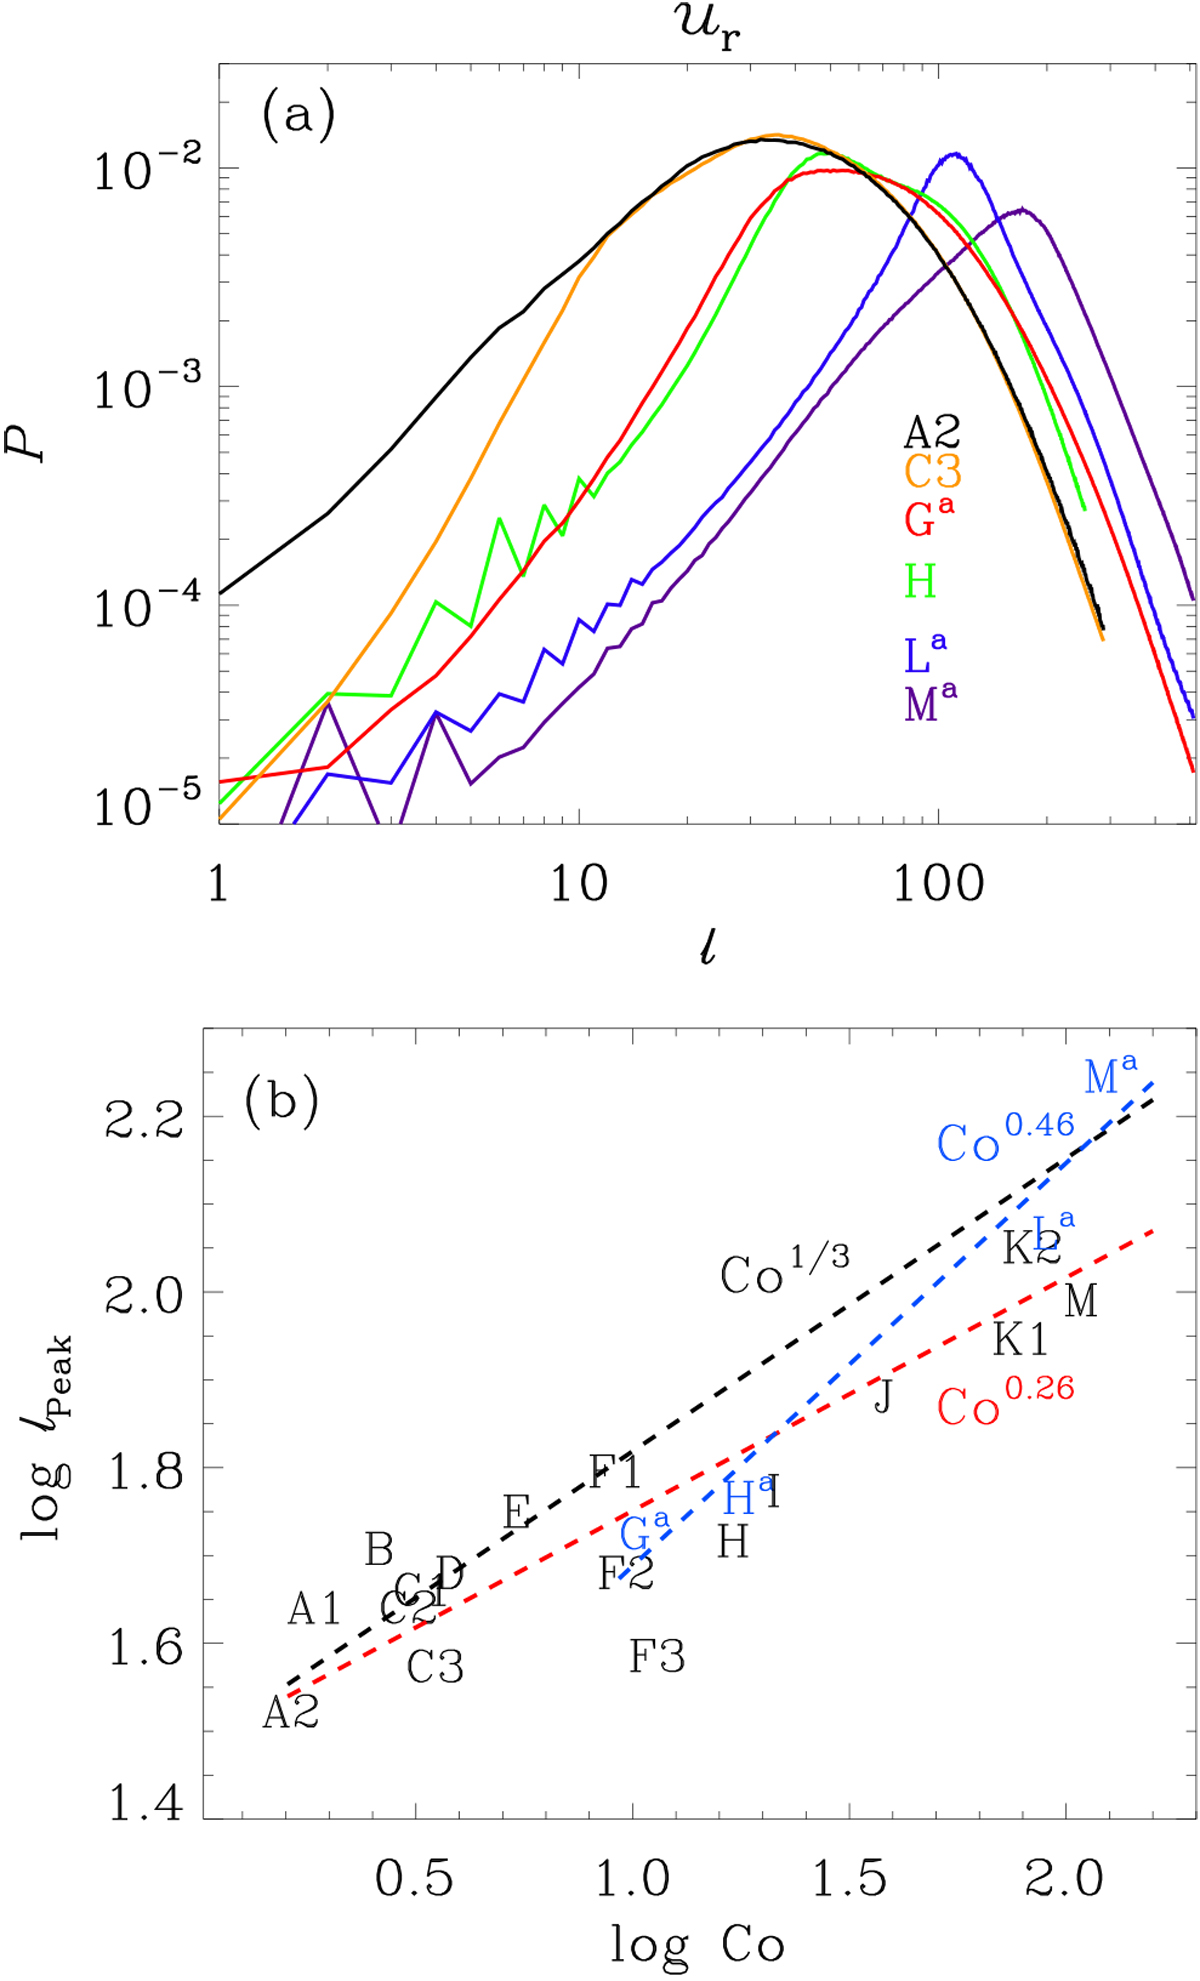
Panel a: normalized power spectra P of the radial velocity as function of degree ℓ for Runs A2, C3, Ga, H, La, and Ma with increasing rotational influence. Panel b: degree of peak power ℓpeak estimated from the power spectra plotted over Coriolis number Co. The runs are indicated with their run names. The red dashed line represents a power law fit including all the runs; the blue dashed line represents the fit for the high-resolution runs, while the black dashed line indicates the expected slope from theoretical estimates (Chandrasekhar 1961).
Current usage metrics show cumulative count of Article Views (full-text article views including HTML views, PDF and ePub downloads, according to the available data) and Abstracts Views on Vision4Press platform.
Data correspond to usage on the plateform after 2015. The current usage metrics is available 48-96 hours after online publication and is updated daily on week days.
Initial download of the metrics may take a while.