Fig. 12
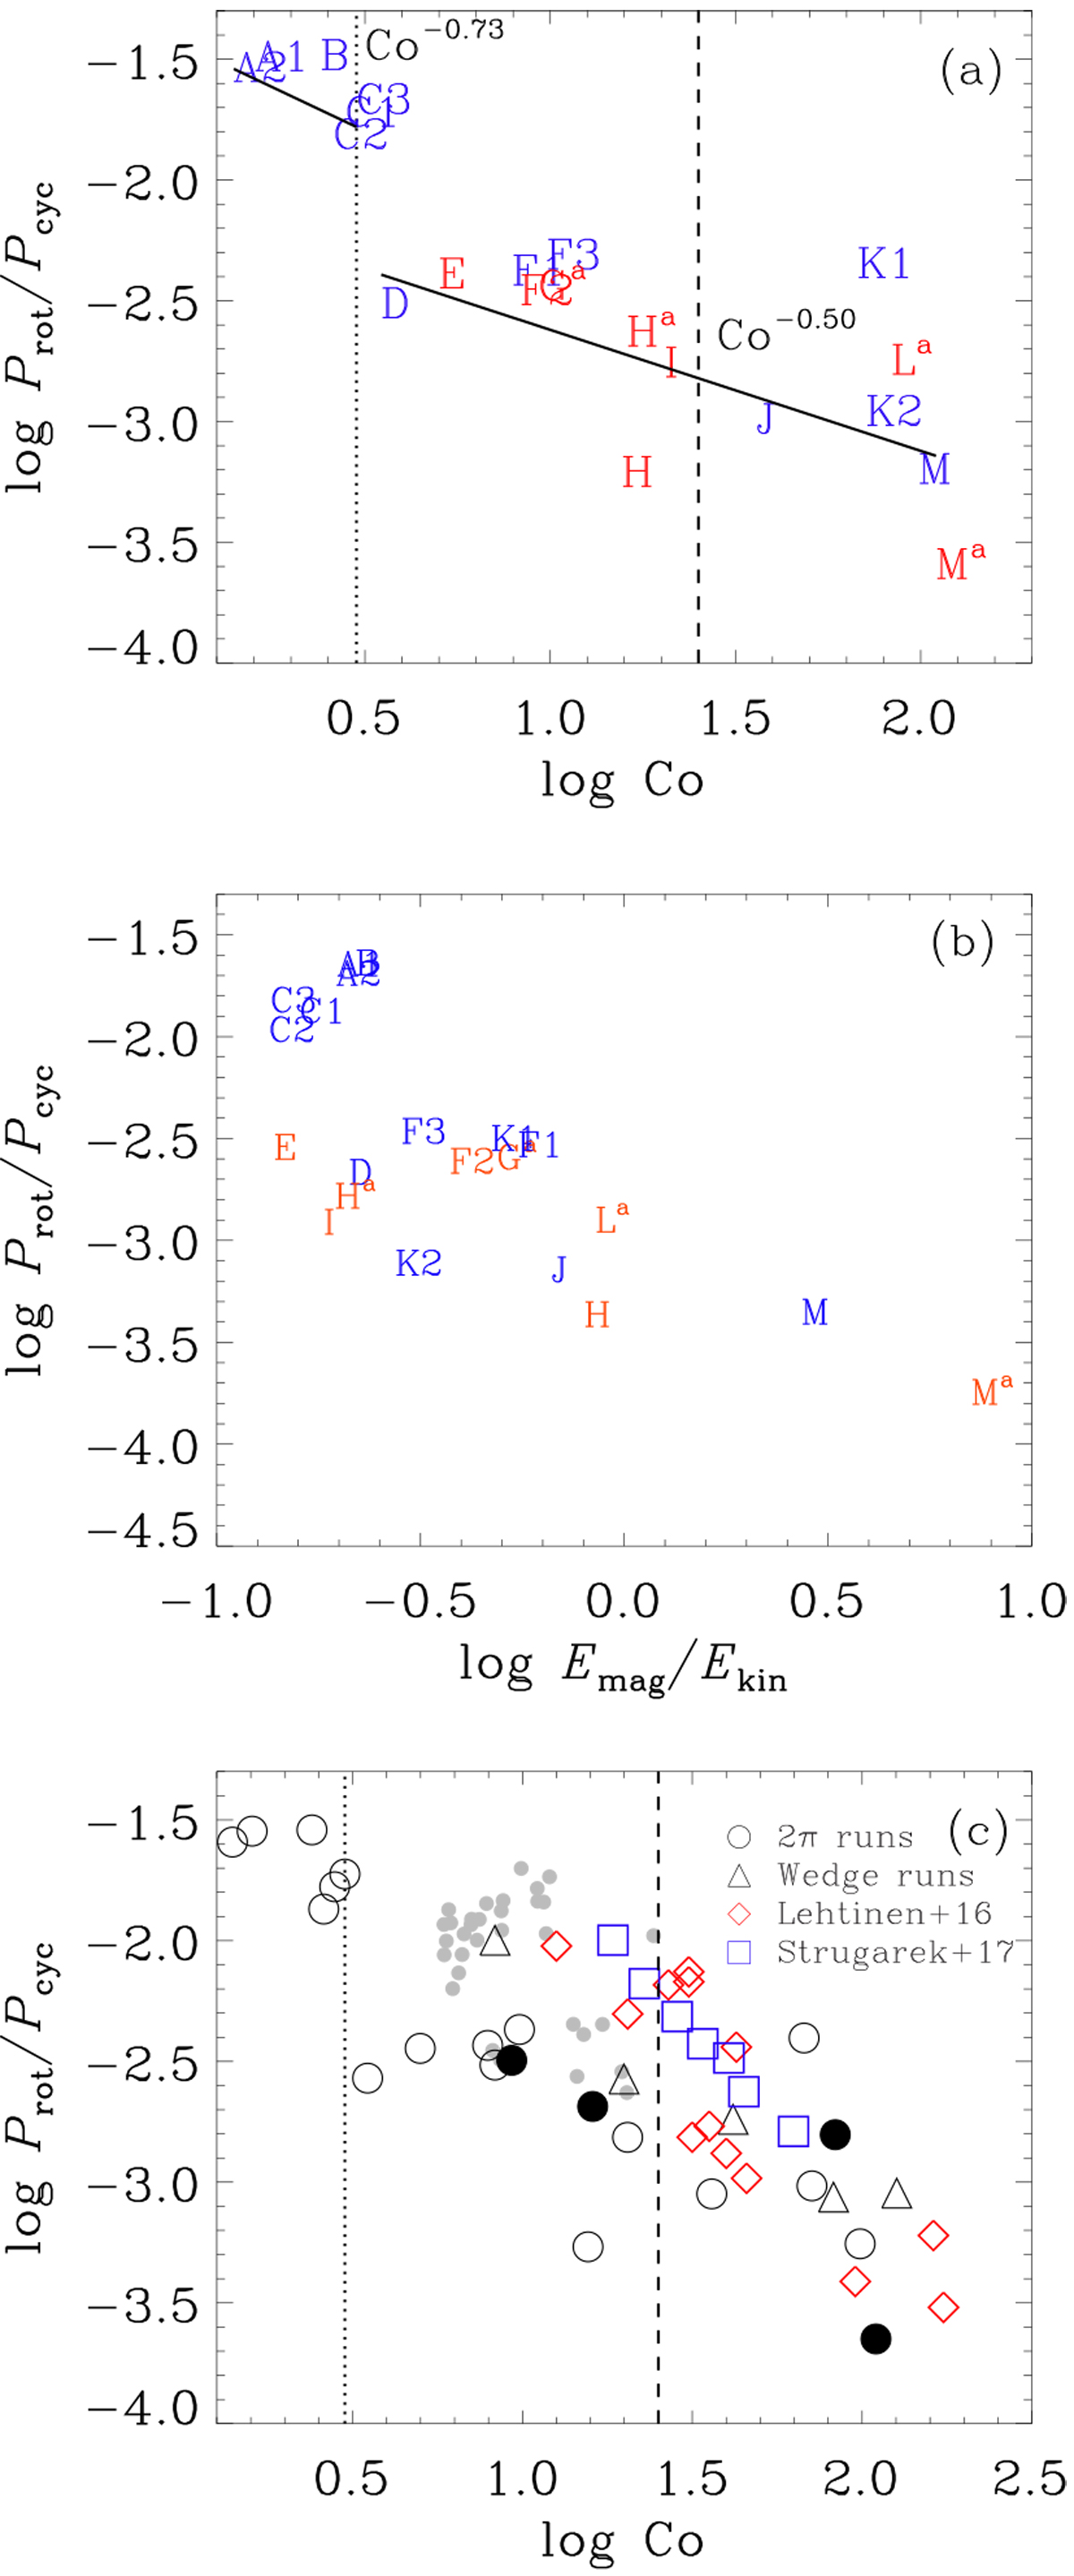
Ratio of the rotation period to the cycle period as a function of Coriolis number (panel a). The two black lines indicate the fit to the axisymmetric and rapid rotation runs, respectively. The vertical lines denote the nonaxisymmetric transition found in our simulations (dotted; Co ≥ 3) and from the observational study of Lehtinen et al. (2016) (dashed), respectively. Runs are plotted after their labels. The color indicates the mode chosen for calculating τcyc: blue for m =0, red for m = 1. Prot ∕Pcyc as function of activity, represented by Emag∕Ekin is shown in panel b. Panel c: comparison between the results presented in this paper, Lehtinen et al. (2016), and Strugarek et al. (2017). Black circles and triangles denote high resolution and π∕2 wedges in our set, respectively. The gray dots indicate M dwarfs and F and G stars from Brandenburg et al. (2017).
Current usage metrics show cumulative count of Article Views (full-text article views including HTML views, PDF and ePub downloads, according to the available data) and Abstracts Views on Vision4Press platform.
Data correspond to usage on the plateform after 2015. The current usage metrics is available 48-96 hours after online publication and is updated daily on week days.
Initial download of the metrics may take a while.