Fig. 6
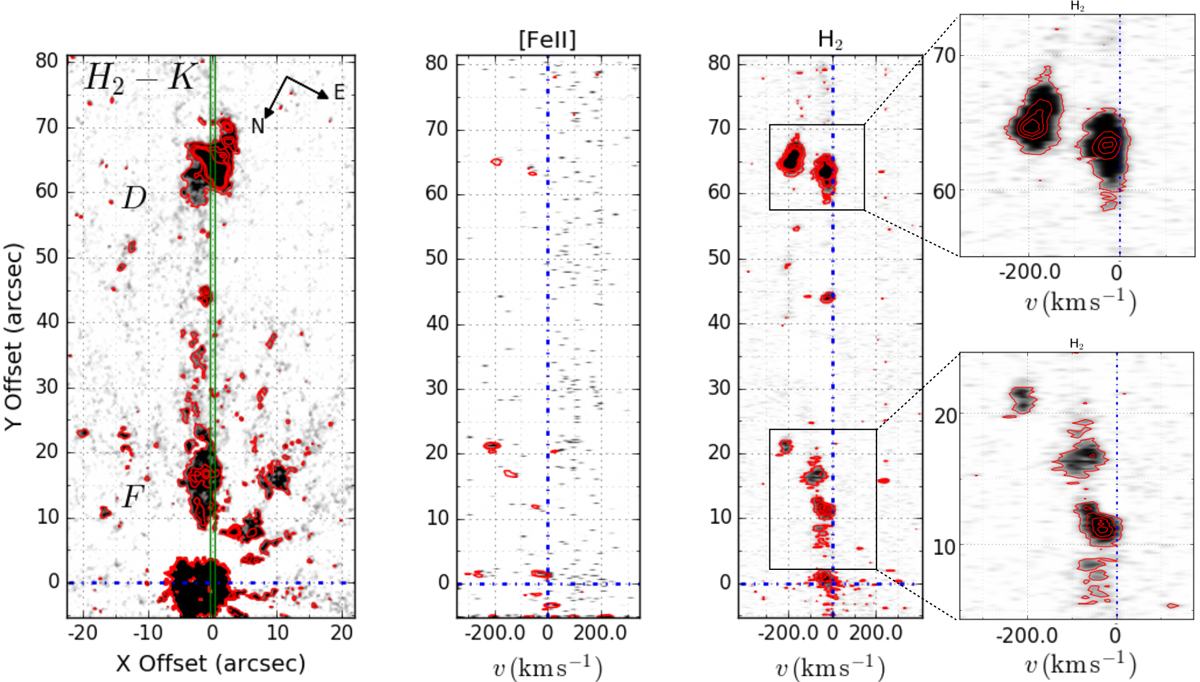
PV diagram of slit 2. Left panel: SOFI H2 − K continuum subtracted image (Caratti o Garatti et al. 2015a). Contours are from 3σ to 20σ in steps of 5σ. Middle panel: [Fe II] (1.644 μm) line PV diagram tracing the atomic jet. Contours range from 3σ to 5σ in steps of 1σ. Right panel: H2 (2.12 μm) line PV diagram tracing the molecular jet. Contours are from 3σ to 20σ in steps of 5σ. Zoom-in panels of knots D (upper) and F (lower) with contours from 3σ to 80σ in steps of 20σ and from 3σ to 20σ in steps of 5σ, respectively.Radial velocities are in the LSR frame.
Current usage metrics show cumulative count of Article Views (full-text article views including HTML views, PDF and ePub downloads, according to the available data) and Abstracts Views on Vision4Press platform.
Data correspond to usage on the plateform after 2015. The current usage metrics is available 48-96 hours after online publication and is updated daily on week days.
Initial download of the metrics may take a while.