Fig. 5
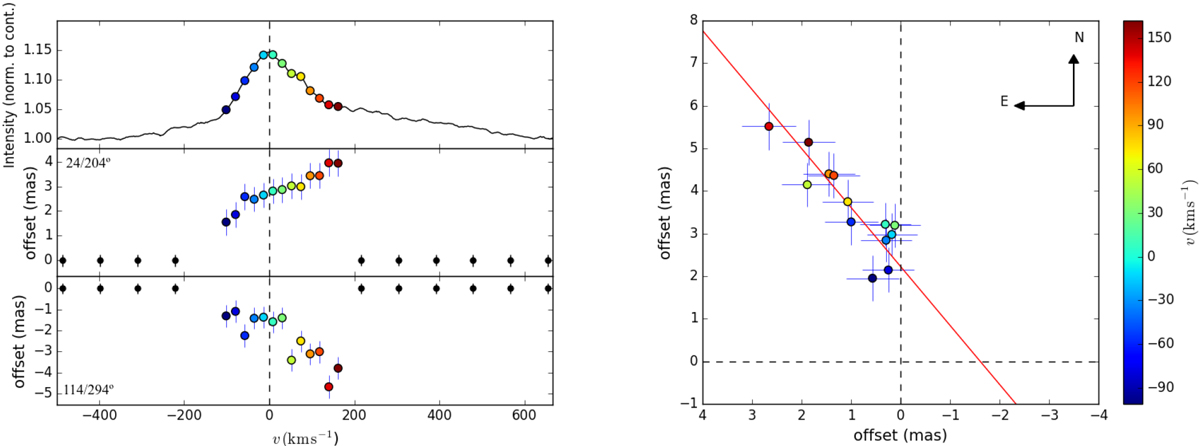
Left panel: CRIRES Brα spectrum (top panel) along with the spectro-astrometric signal (in mas) detected in the jet parallel (middle panel) and perpendicular slit (bottom panel). The spectro-astrometric signal is continuum-corrected. Right panel: spectro-astrometric signal on the plane of the sky (north is up and east is to the left). The red line is the linear fit to the points giving a PA for the line-emitting region of 216° ± 5°. Error bars shown in both plots are 3σ. Velocities are colour coded and are the same in both panels.
Current usage metrics show cumulative count of Article Views (full-text article views including HTML views, PDF and ePub downloads, according to the available data) and Abstracts Views on Vision4Press platform.
Data correspond to usage on the plateform after 2015. The current usage metrics is available 48-96 hours after online publication and is updated daily on week days.
Initial download of the metrics may take a while.