Fig. C.1.
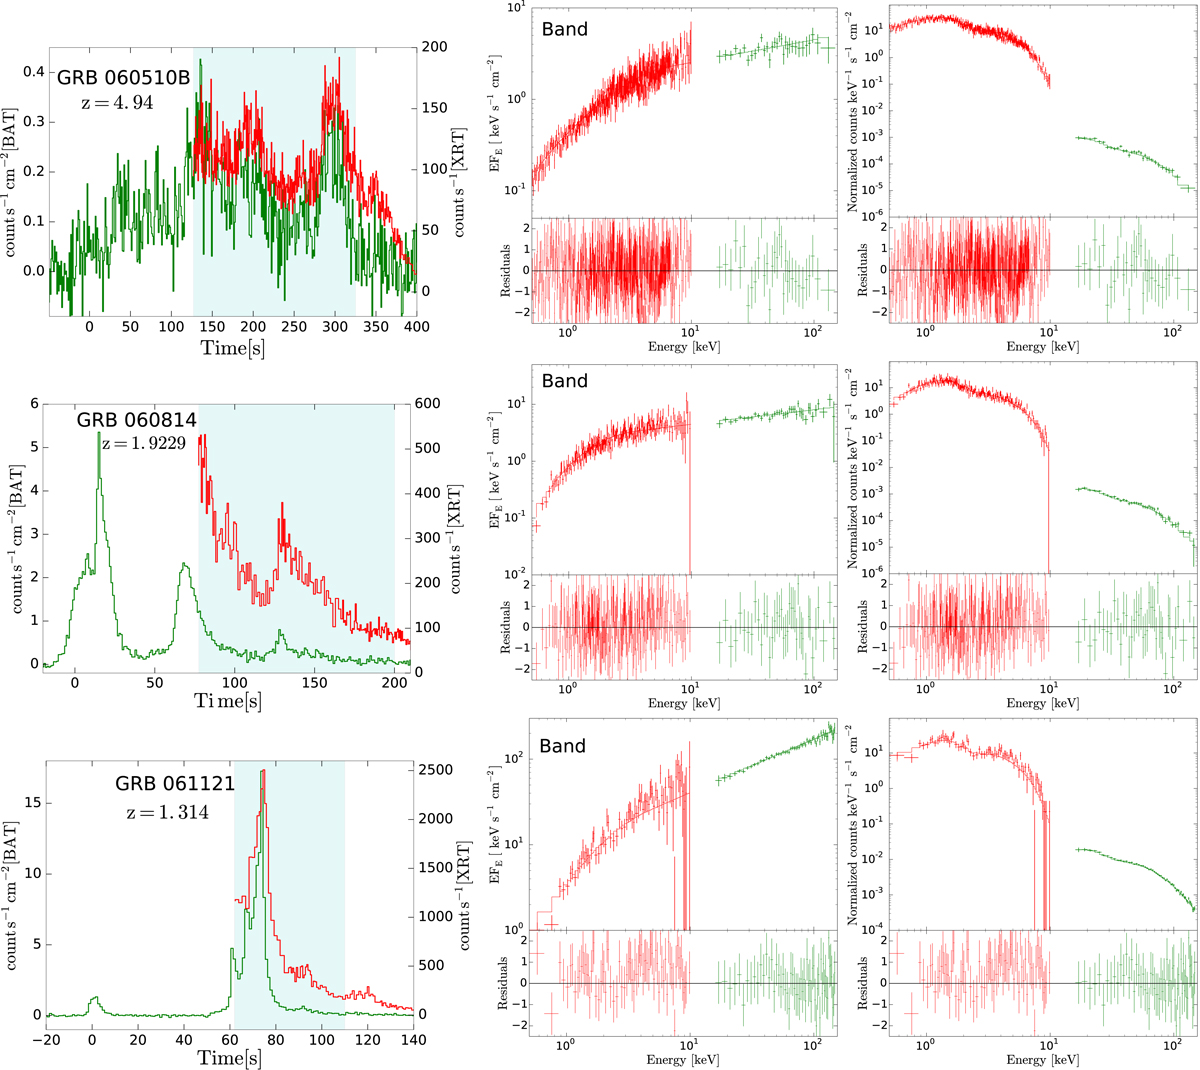
Light curves (left-hand panel) and spectra (middle and right-hand panel) for each GRB in the sample. The light-blue shaded area in the left-hand panels highlights the time interval chosen for the spectral analysis. Middle panels: νFν spectra and the best fit model. We note that the data points in the νFν panels have been derived for a specific model, and should not be used to perform comparisons with a different model. Right-hand panels: count spectra. In all panels, XRT data are shown in red, BAT in green, GBM-NaI in blue and light-blue, and GBM-BGO in purple.
Current usage metrics show cumulative count of Article Views (full-text article views including HTML views, PDF and ePub downloads, according to the available data) and Abstracts Views on Vision4Press platform.
Data correspond to usage on the plateform after 2015. The current usage metrics is available 48-96 hours after online publication and is updated daily on week days.
Initial download of the metrics may take a while.