Fig. A.1.
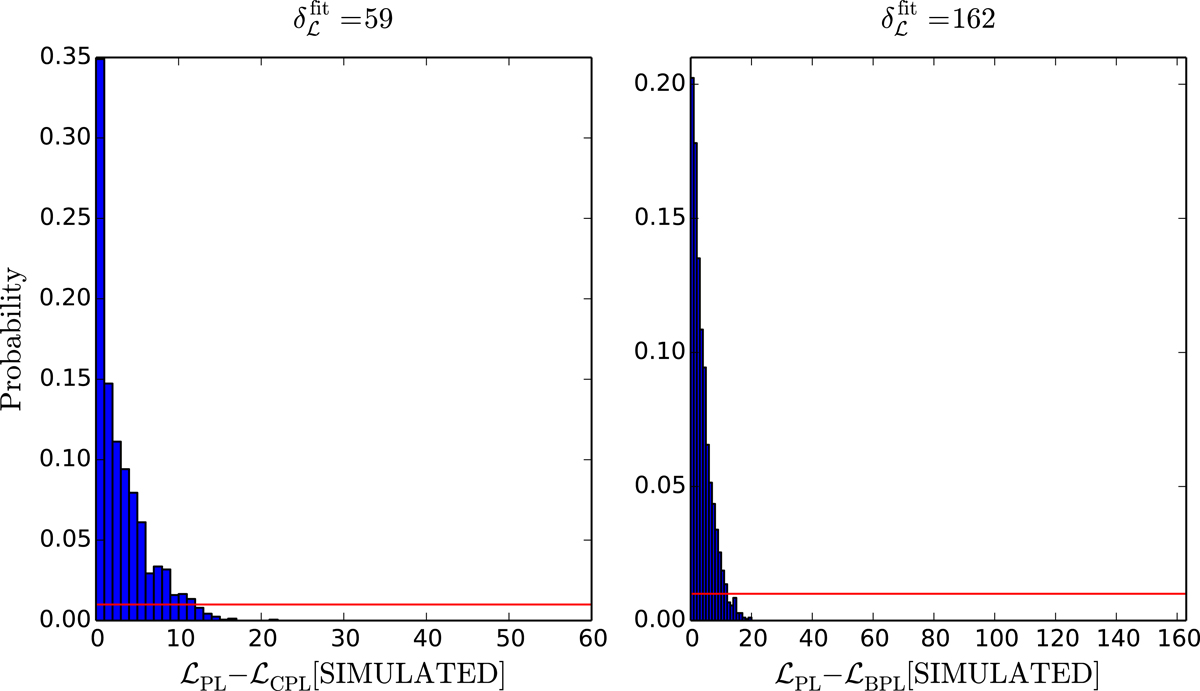
Left panel: distribution of the improvement of the CPL fit with respect to the PL fit, for 1000 fake spectra. All fake spectra have been simulated adopting the best fit model obtained fitting a PL model to the observed spectrum of GRB 080928. A δℒ > 11 corresponds to a probability <1% to have a stochastic improvement (horizontal red line in the figure). The δℒ obtained when the real spectrum is fitted with a PL and a CPL is δℒPL−CPL = 59, corresponding to a chance probability much smaller than 1%. Right panel: as in the left panel, but the PL fits are compared to BPL fits. Also in this case, the improvement δℒ = 162 exceeds the critical value of 12.
Current usage metrics show cumulative count of Article Views (full-text article views including HTML views, PDF and ePub downloads, according to the available data) and Abstracts Views on Vision4Press platform.
Data correspond to usage on the plateform after 2015. The current usage metrics is available 48-96 hours after online publication and is updated daily on week days.
Initial download of the metrics may take a while.