Fig. 6.
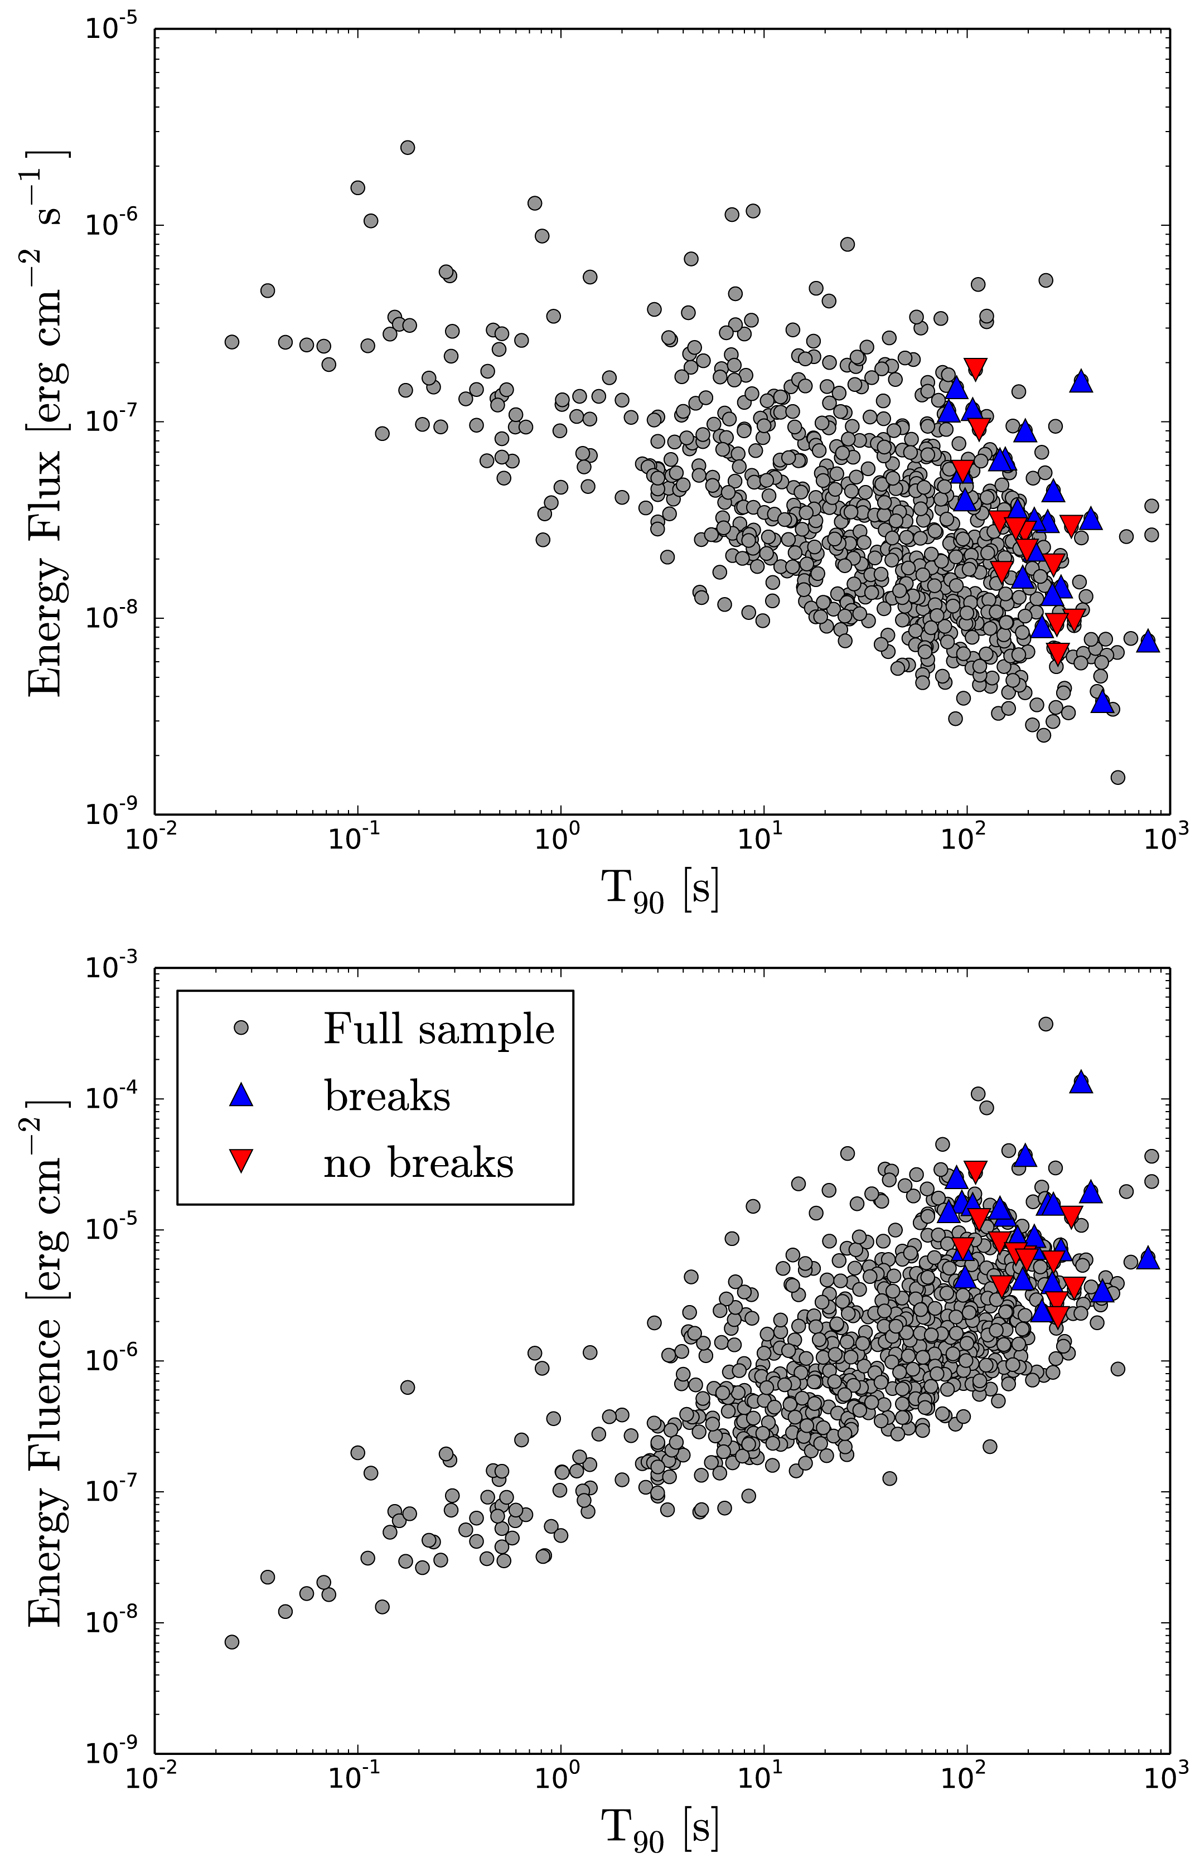
Comparison in terms of flux, fluence, and T90 between the sample studied in this work (triangles) and the full catalog of BAT GRBs, from Lien et al. (2016; gray circles). Our sample is divided into two classes: GRBs with a low-energy break (blue triangles) and GRBs without a low-energy break (red upside-down triangles). Upper panel: average flux vs. T90. Lower panel: fluence vs. T90.
Current usage metrics show cumulative count of Article Views (full-text article views including HTML views, PDF and ePub downloads, according to the available data) and Abstracts Views on Vision4Press platform.
Data correspond to usage on the plateform after 2015. The current usage metrics is available 48-96 hours after online publication and is updated daily on week days.
Initial download of the metrics may take a while.