Fig. 4.
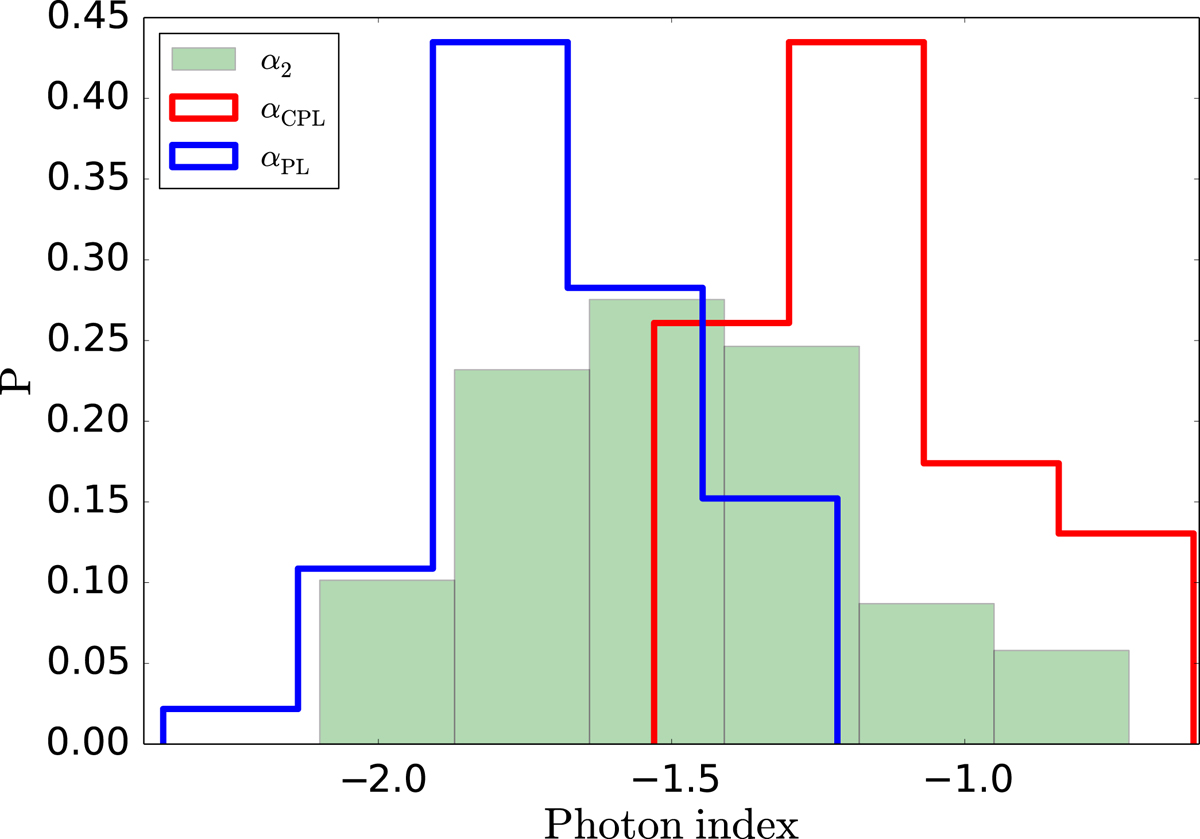
Distribution of photon indices describing the spectrum below the peak energy, for the merged sample studied in O17 and this paper. The green histogram shows the indices α2 describing the spectrum between Ebreak and Epeak. The blue and red histograms show the distribution of for the same sample of spectra, obtained when the analysis is performed without including XRT. The red histogram denotes cases where the best model is a CPL, and the blue histogram cases where the best-fit model is a single PL.
Current usage metrics show cumulative count of Article Views (full-text article views including HTML views, PDF and ePub downloads, according to the available data) and Abstracts Views on Vision4Press platform.
Data correspond to usage on the plateform after 2015. The current usage metrics is available 48-96 hours after online publication and is updated daily on week days.
Initial download of the metrics may take a while.