Fig. 3.
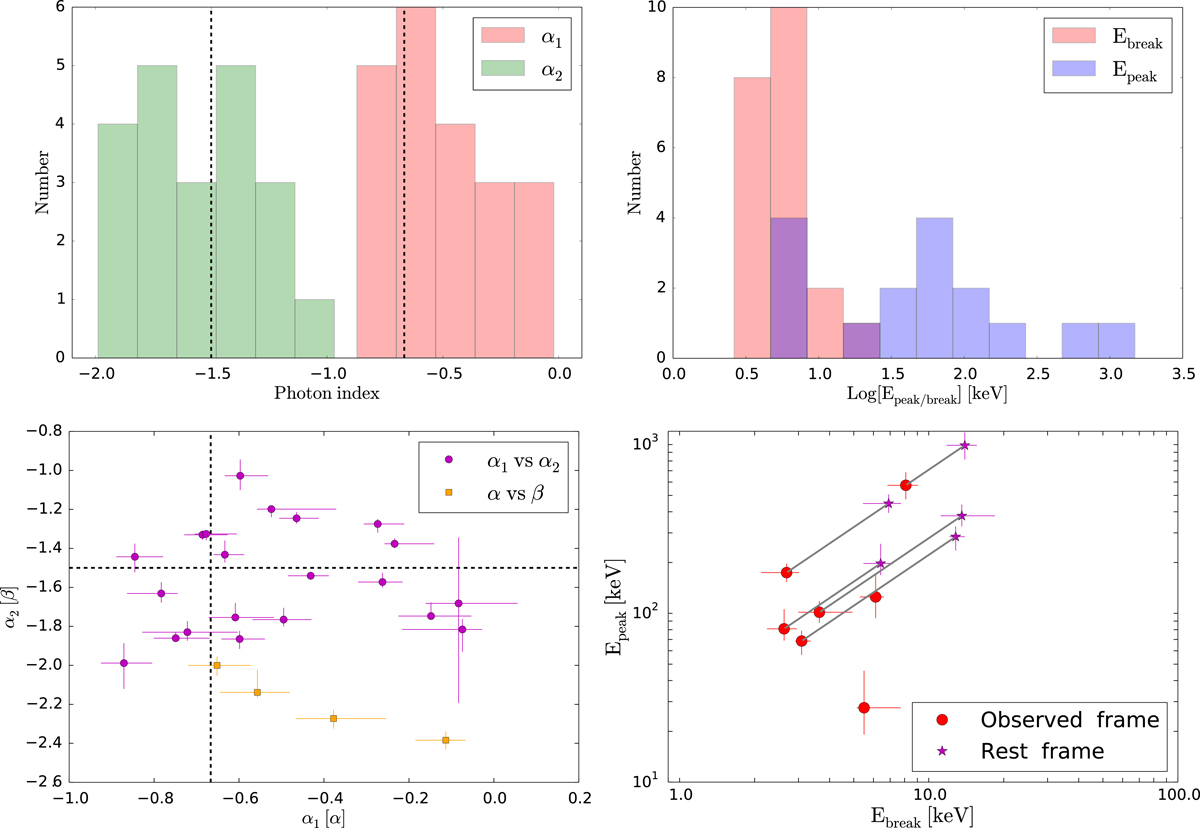
Best fit parameters resulting from the spectral analysis of the full sample. Left-hand panels: photon indices. Right-hand panels: peak and break energies. Top left: distribution of α1 (red) and β2 (green), representing the indices below and above the break energy. Bottom left: α1 vs. α2 (circles) and α vs. β for GRBs with a spectrum modeled by a Band function with second index < −2 (squares). In both left-hand panels, the values for α1 and α2 predicted from fast cooling synchrotron emission are drawn as dashed lines. In the bottom panel they should be used as reference lines for the circle symbols only. Top right: Epeak (blue) and Ebreak (red) distributions. Bottom right: Epeak vs. Ebreak for spectra where both features can be constrained (Bandcut model). Circles refer to the observer frame, while stars are used for the rest frame, for those GRBs with measured redshift. The positions before and after cosmological redshift correction are connected with a solid line.
Current usage metrics show cumulative count of Article Views (full-text article views including HTML views, PDF and ePub downloads, according to the available data) and Abstracts Views on Vision4Press platform.
Data correspond to usage on the plateform after 2015. The current usage metrics is available 48-96 hours after online publication and is updated daily on week days.
Initial download of the metrics may take a while.