Fig. 1.
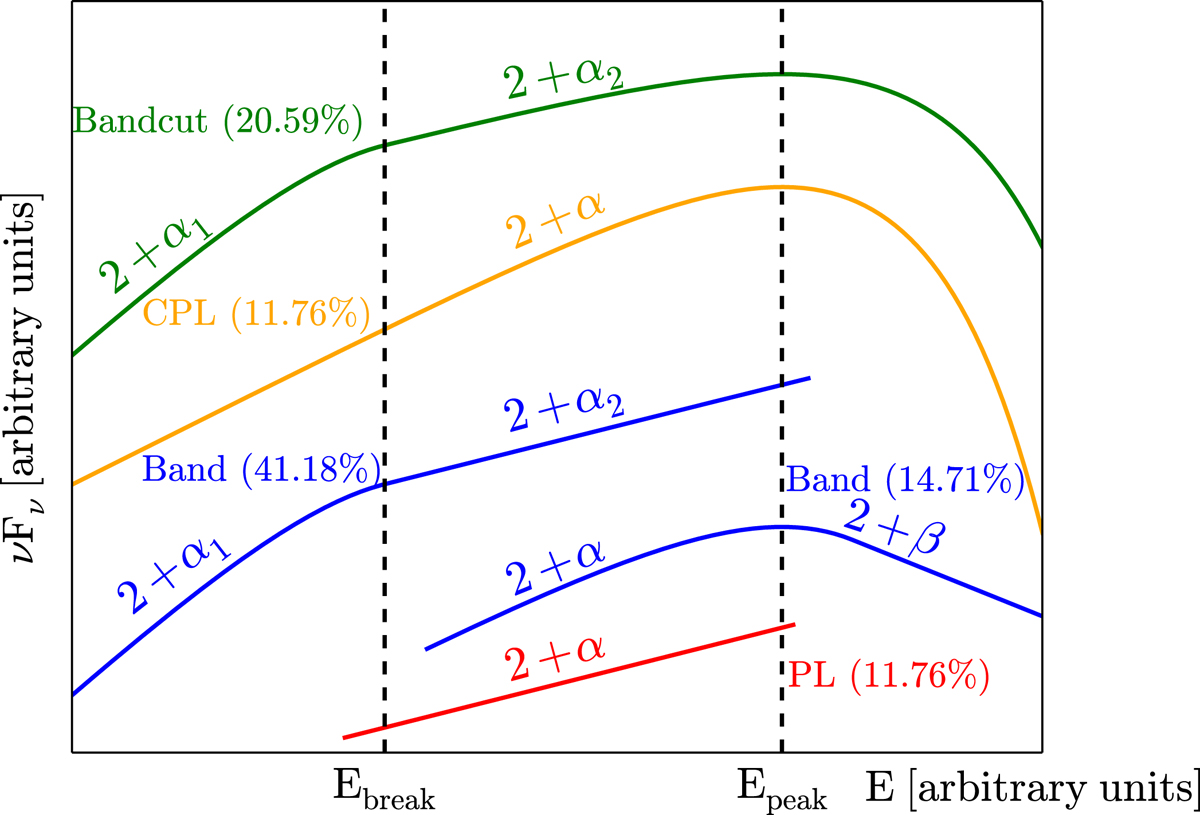
Spectral models (in νFν representation) tested in this work. From top to bottom: a Band function with a high-energy exponential cutoff (Bandcut, green), a Cutoff power-law model (CPL, orange), a Band function (Band, blue) and a single power-law model (PL, red). The Band model can describe two different cases: either both spectral indices are larger than −2, or the second one is smaller than −2. In all models, we use the letter α for spectral segments where the νFν flux increases with energy (and distinguish between α1 and α2 in case two increasing segments, separated by a spectral break, are present), and β to refer to a decreasing spectral segment. The number within brackets next to the model name refers to the percentage of cases for which each model provides the best fit to the data.
Current usage metrics show cumulative count of Article Views (full-text article views including HTML views, PDF and ePub downloads, according to the available data) and Abstracts Views on Vision4Press platform.
Data correspond to usage on the plateform after 2015. The current usage metrics is available 48-96 hours after online publication and is updated daily on week days.
Initial download of the metrics may take a while.