Fig. 8
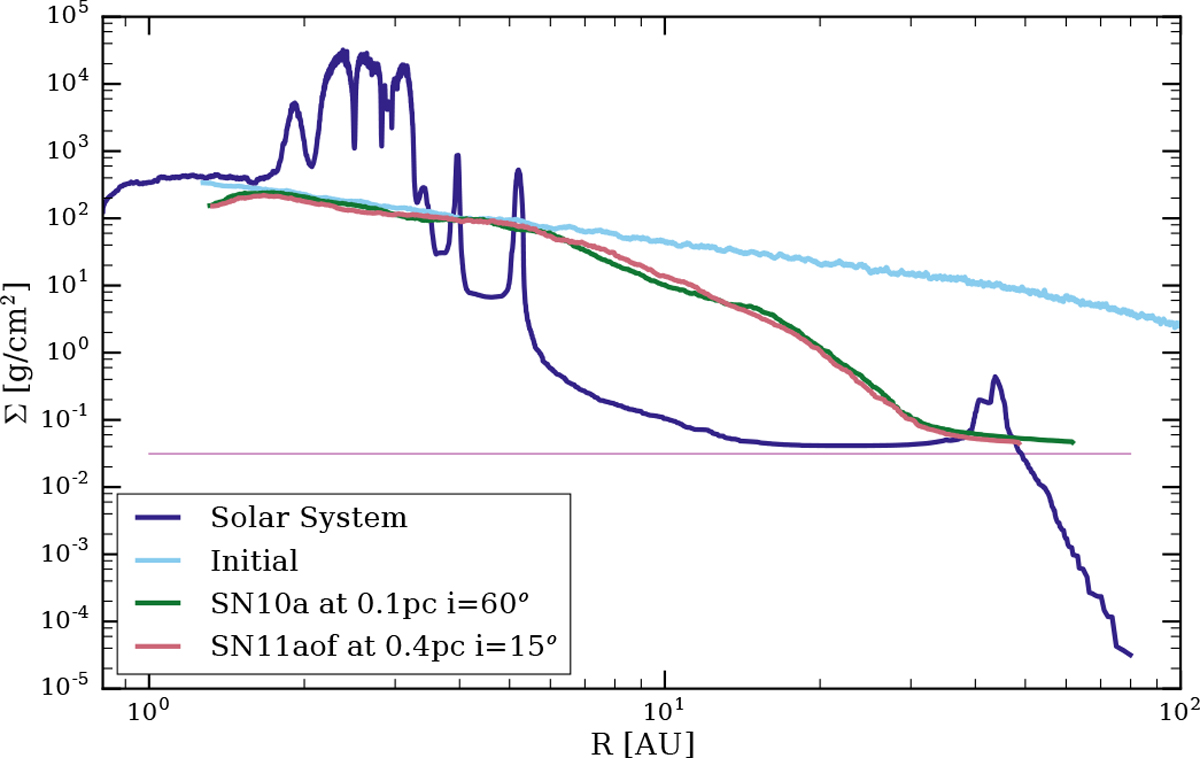
Surface density profile of the proto planetary disk at two moments in time for two supernovae SN10a (green) and the much brighter SN11aof (red). The former was at a distance of d = 0.1 pc and with an impact angle of Θ = 60°, the latter at a distance of d = 0.4 pc and with an angle of Θ = 15°. The dark blue curve indicates the surface density distribution of the known planetesimals in the solar system (see http://minorplanetcenter.net/data). The total mass of the Sun’s planetesimal disk was normalized to the initial disk mass in our simulations (0.01 M⊙). The initial density profile of the disk (light blue) is the same for each model. The thin periwinkle-colored horizontal line indicates the minimum disk-mass we adopted, truncating the solar system’s disk at about 55 au.
Current usage metrics show cumulative count of Article Views (full-text article views including HTML views, PDF and ePub downloads, according to the available data) and Abstracts Views on Vision4Press platform.
Data correspond to usage on the plateform after 2015. The current usage metrics is available 48-96 hours after online publication and is updated daily on week days.
Initial download of the metrics may take a while.