Fig. 4
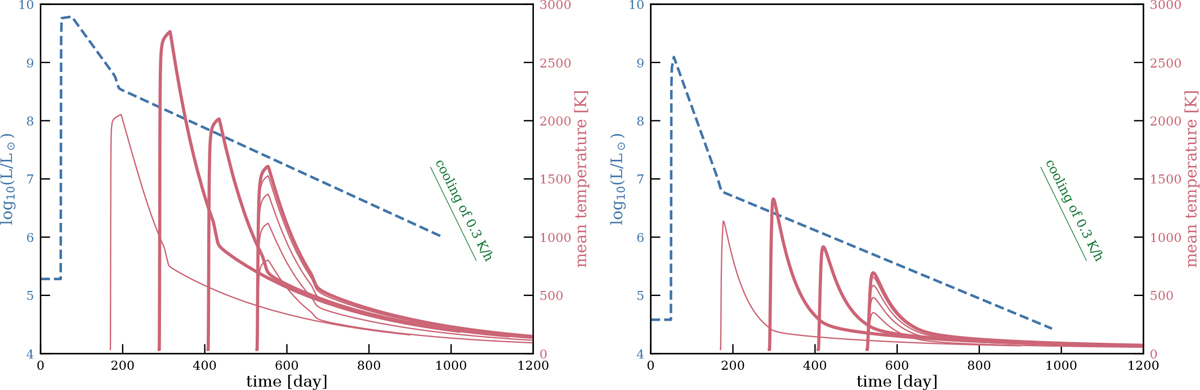
Light curves and disk temperatures for the type IIp supernovae SN11aof (left panel) and SN10a (right panel). The dashed blue curves with the scales in blue to the left of the respective panels give the luminosity of the supernova, and are power-law fits from Sanders et al. (2015). The red curves give the mean temperature of the disk at distances of 0.1, 0.2, 0.3 and 0.4 pc (from left to right). For the latter, we present curves (bottom to top curve) for an inclination of 15°, 30°, 45°, 60° and 75°. For the distance of 0.1 pc, we only show the disk temperature for the inclination angle of 75°, and for the other two distances at 15°. In the right-hand panel, we show the same curves but for supernova SN10a. The thin green line (to the upper right) indicates a cooling of 0.3 K h−1, which is consistent with the cooling after the supernova radiation has heated the disk for SN11aof. In Sect. 4.1, we discuss the effect of the heating on structure of vitreous chondrules in the disk.
Current usage metrics show cumulative count of Article Views (full-text article views including HTML views, PDF and ePub downloads, according to the available data) and Abstracts Views on Vision4Press platform.
Data correspond to usage on the plateform after 2015. The current usage metrics is available 48-96 hours after online publication and is updated daily on week days.
Initial download of the metrics may take a while.