Free Access
Fig. 3
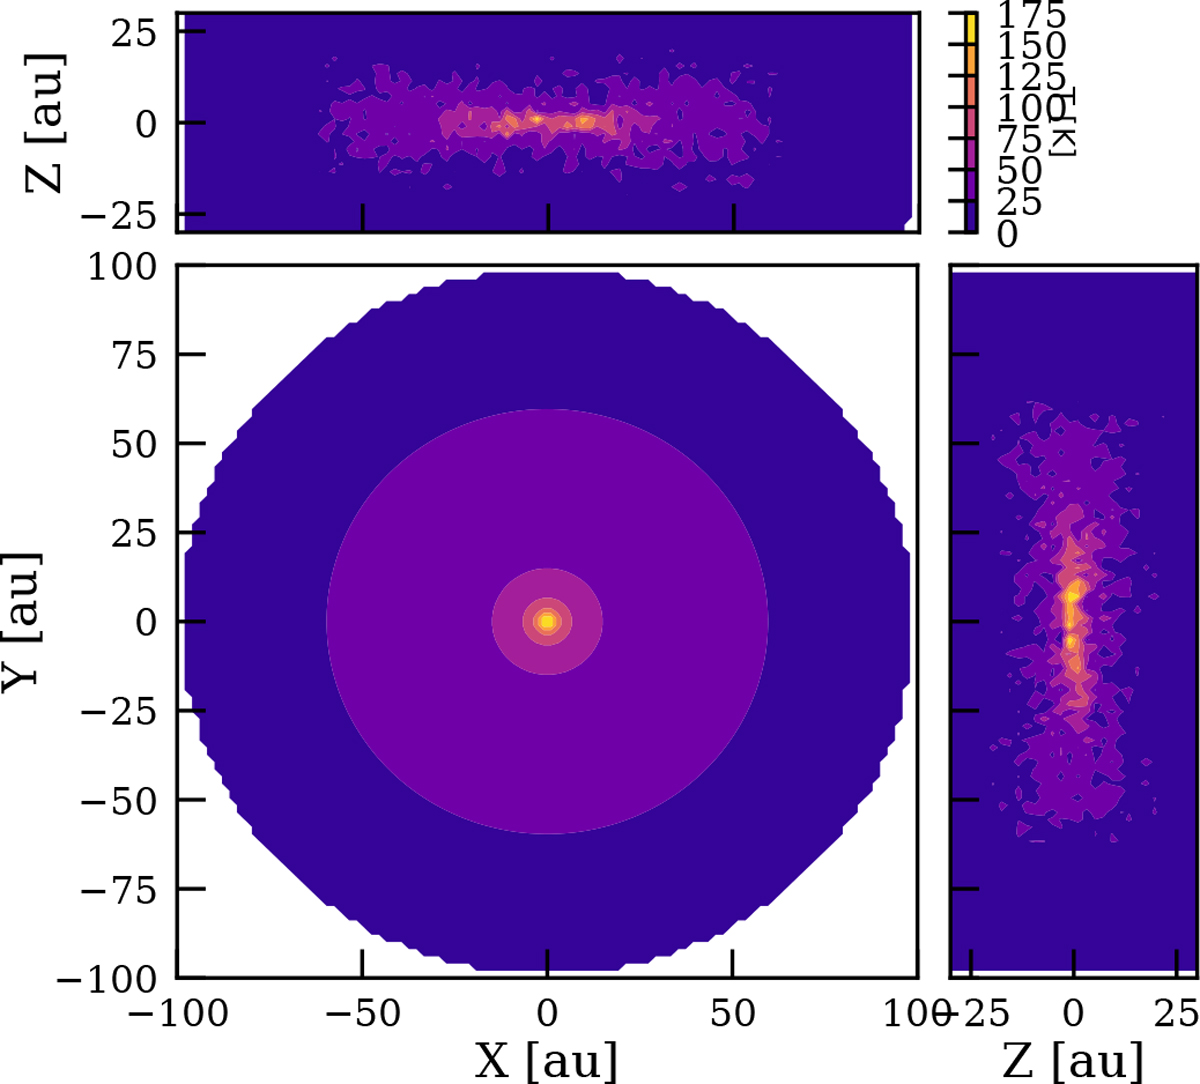
Top view of the protoplanetary disk from three sides, the top view (x-y) image in the middle and two size aspects to the right and top. The colors represent temperature, and the coding is represented by the bar to the top right.
Current usage metrics show cumulative count of Article Views (full-text article views including HTML views, PDF and ePub downloads, according to the available data) and Abstracts Views on Vision4Press platform.
Data correspond to usage on the plateform after 2015. The current usage metrics is available 48-96 hours after online publication and is updated daily on week days.
Initial download of the metrics may take a while.