Fig. A.1.
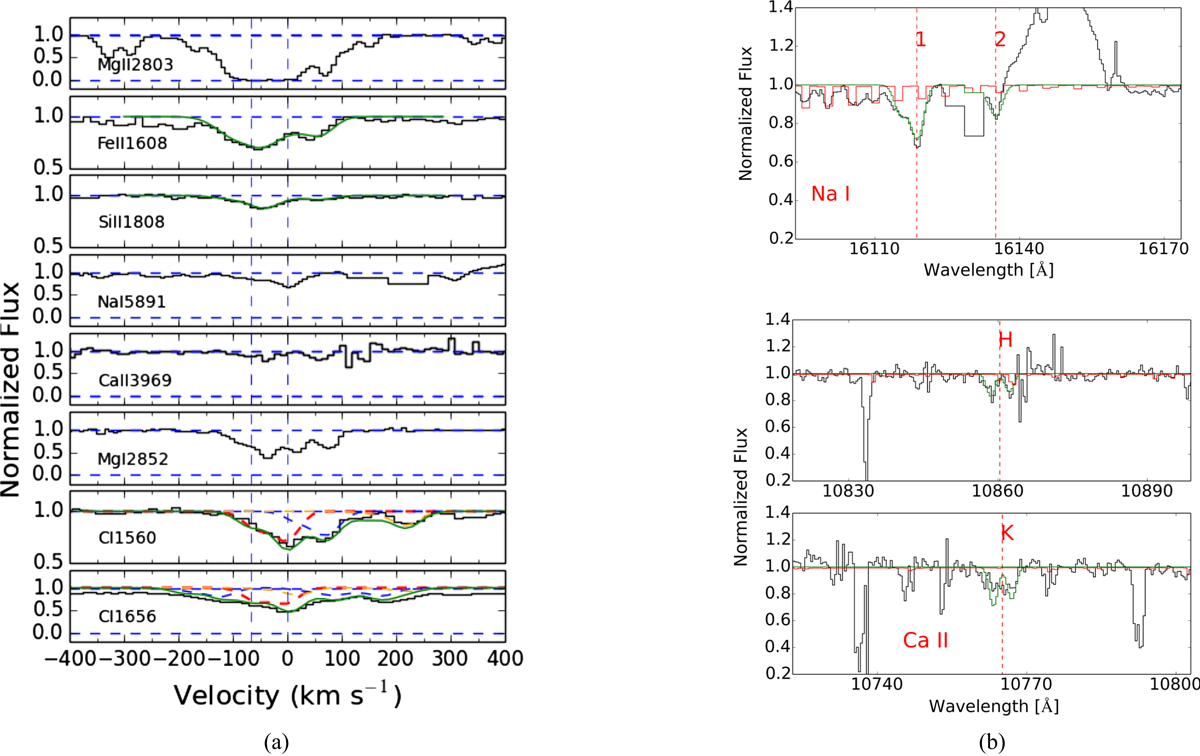
J0216−0021 : left panels (a): velocity plot of a sub-set of the absorbing species. The vertical dashed lines indicate the positions of the C I components. Fits to the absorption profiles are over-plotted with the data. For C I transitions, the red dashed line corresponds to the true ground state, the blue dashed line is for the C I* absorption, and the orange dashed line is for the C I✻✻ absorption. The redshift is taken in Table 1 to give the zero velocity. Right panels (b): upper panel is the spectrum at the expected position of Na Iλλ5891,5897, the 1 and 2 indicate the Na Iλ5891 and Na Iλ5897 lines respectively; lower panel is the spectrum at the expected positions of the Ca IIλλ3934,3969 lines, the H and K notations indicate the Ca IIλ3969 and Ca IIλ3934 lines respectively. The red curve is the telluric spectrum template of X-shooter: In this system the Ca II K line is clearly detected but we indicate an upper limit for the H line since the data around the H line is noisy (see Fig. A.1b lower panel). The Na I D is detected clearly even though there are strong spikes close to the two absorption lines (see Fig. A.1b upper panel). We subtracted the equivalent width of the weak telluric contamination. The C Iλ1560 line is not used in the fit of the C I absorption as it is strongly blended. There are two components at z = 1.735283 and 1.735888, while the strongest component of Fe II, Si II, and Mg I is seen in-between these two components (see also J1248+2848). This could be an artefact due to the spectral resolution. To discuss the details of the structure of the absorbing cloud, higher resolution data are needed.
Current usage metrics show cumulative count of Article Views (full-text article views including HTML views, PDF and ePub downloads, according to the available data) and Abstracts Views on Vision4Press platform.
Data correspond to usage on the plateform after 2015. The current usage metrics is available 48-96 hours after online publication and is updated daily on week days.
Initial download of the metrics may take a while.