Fig. 9.
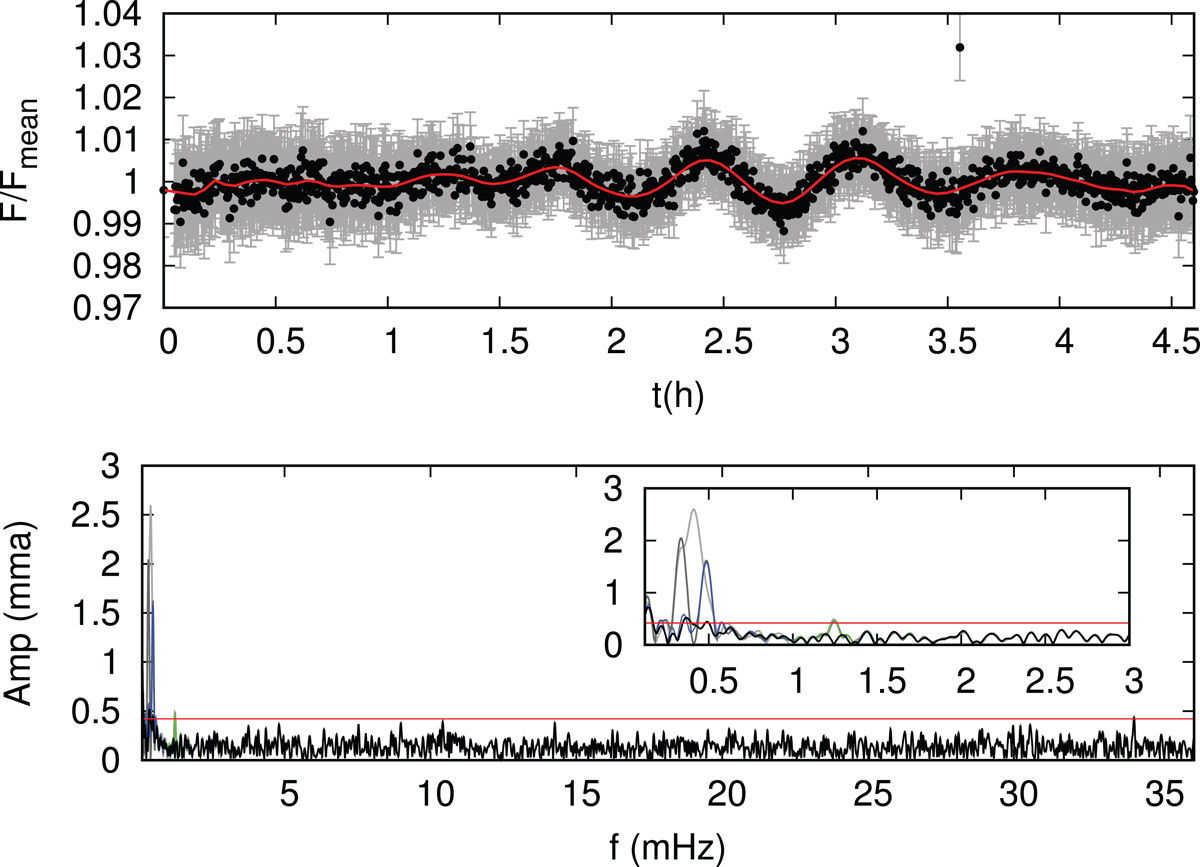
Top panel: light curve for J075738.94+144827.5. Error bars are shown in gray and a smoothed light curve is shown in red. Bottom panel: original Fourier transform in gray, and the subsequent Fourier transforms, subtracting periods above the 3 ~ σ detection limit, in different colors. The final detection limit, above which no further periods were found, is shown in red.
Current usage metrics show cumulative count of Article Views (full-text article views including HTML views, PDF and ePub downloads, according to the available data) and Abstracts Views on Vision4Press platform.
Data correspond to usage on the plateform after 2015. The current usage metrics is available 48-96 hours after online publication and is updated daily on week days.
Initial download of the metrics may take a while.