Fig. 2.
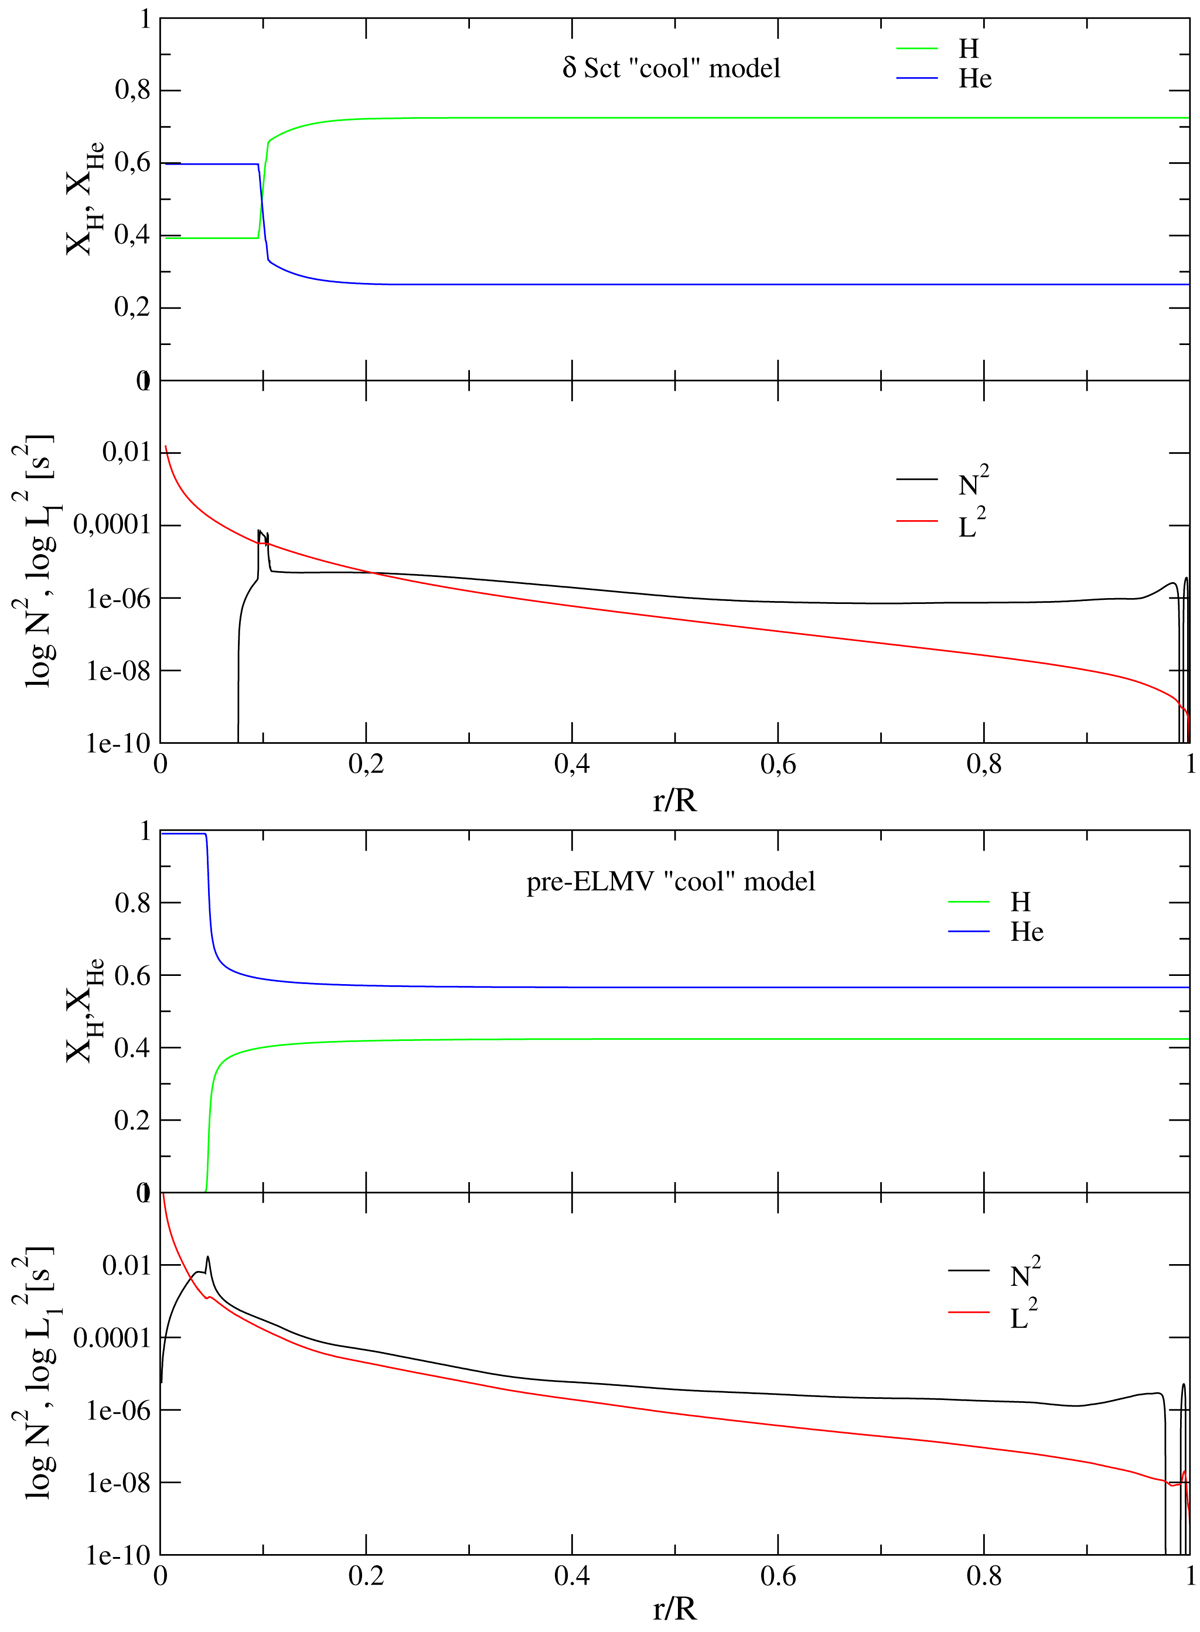
Abundances by mass of He and H as a function of the normalized radius (top panels), and propagation diagrams (the run of the logarithm of the squared Brunt–Väisälä and Lamb frequencies, lower panels) corresponding to the δ Sct model (upper panel), and to the pre-ELMV model (lower panel) indicated as a triangle up symbol in Fig. 1.
Current usage metrics show cumulative count of Article Views (full-text article views including HTML views, PDF and ePub downloads, according to the available data) and Abstracts Views on Vision4Press platform.
Data correspond to usage on the plateform after 2015. The current usage metrics is available 48-96 hours after online publication and is updated daily on week days.
Initial download of the metrics may take a while.