Free Access
Fig. 7.
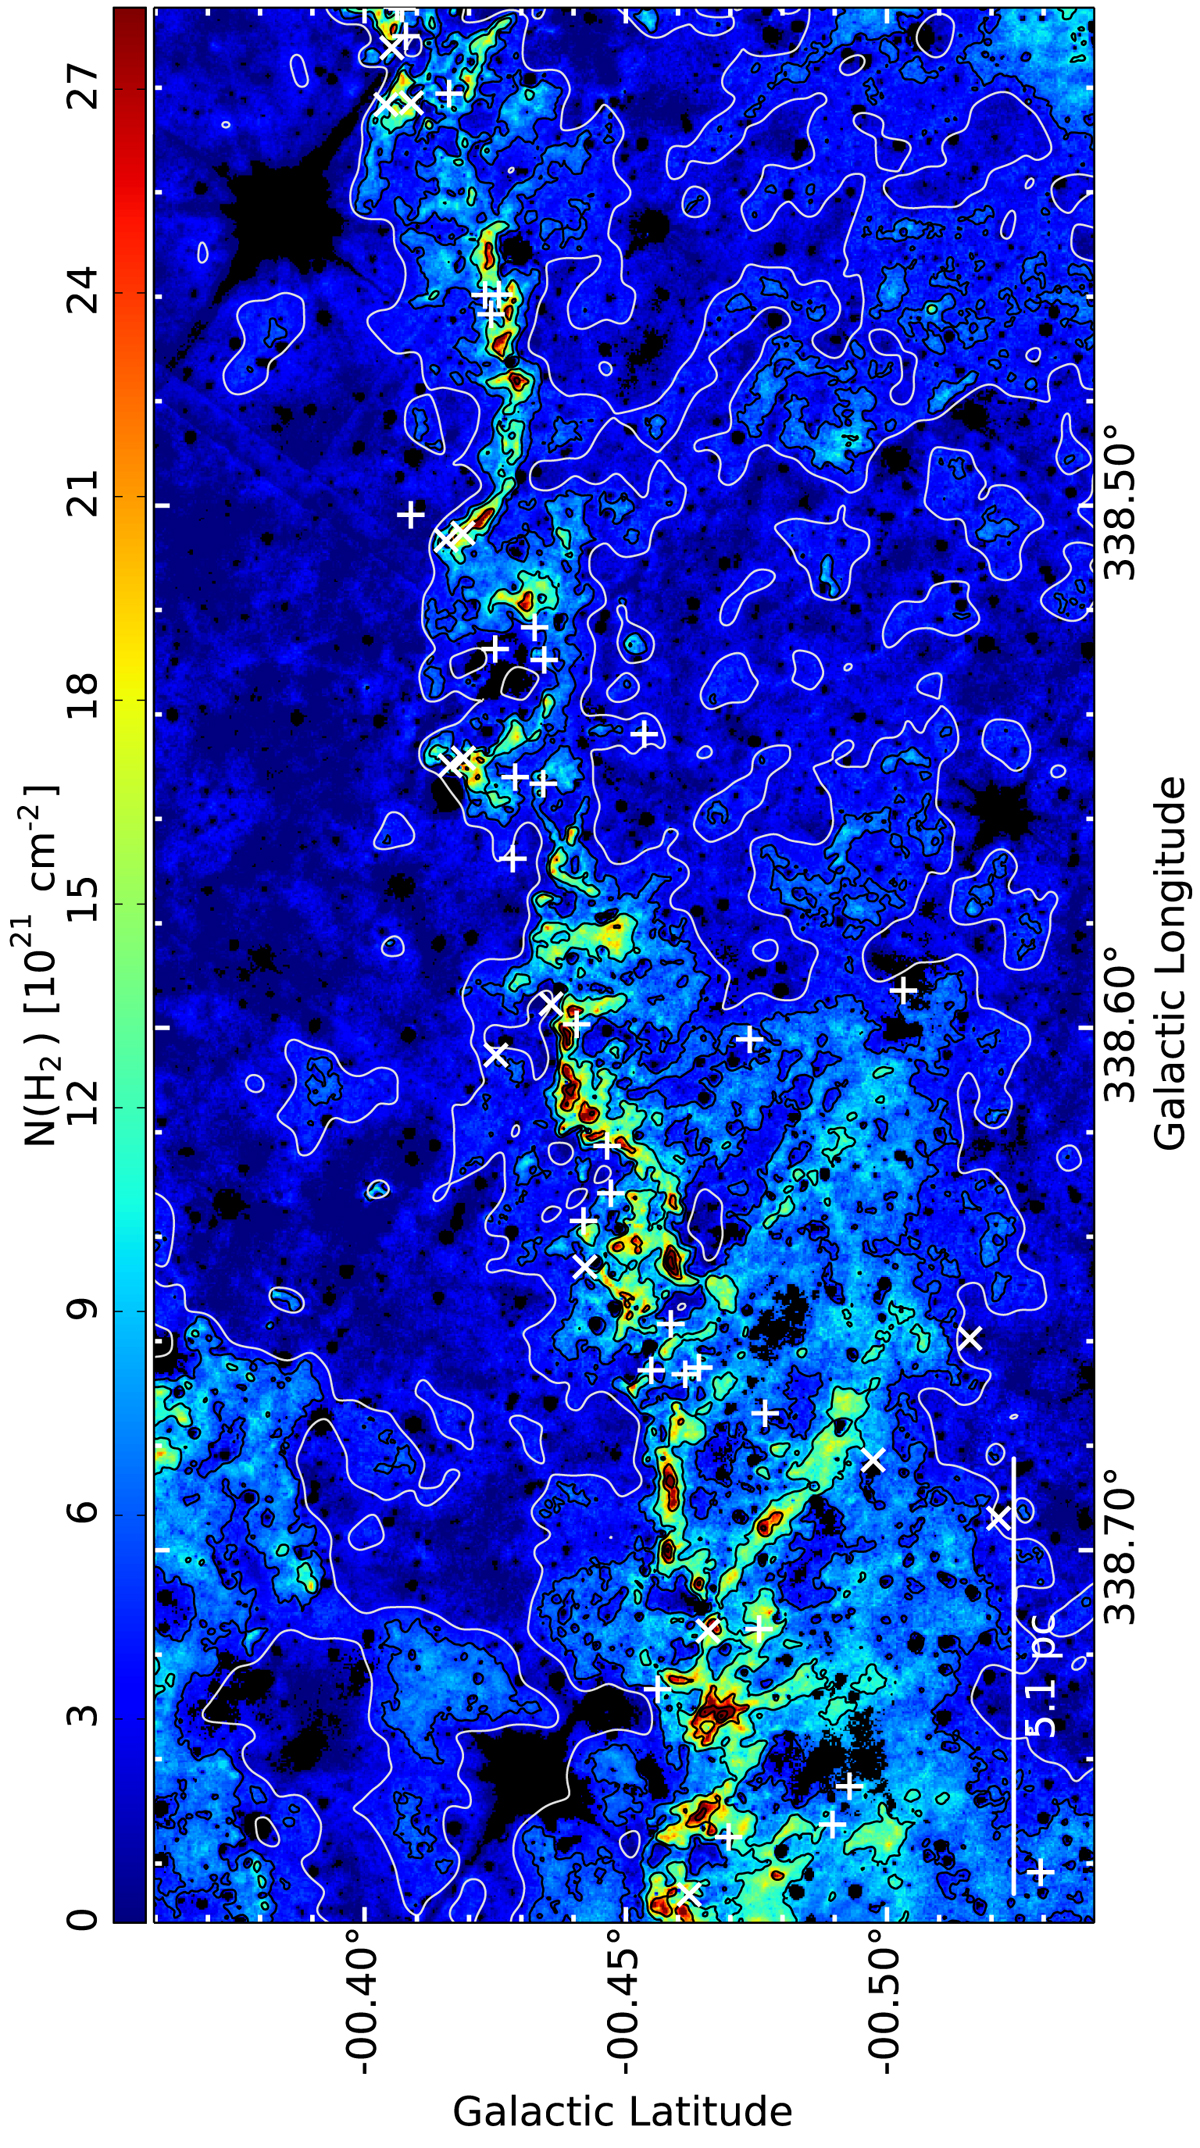
Zoom-in number two of the column density map (Fig. 5). The black contours indicate the levels of 5, 10, 20, 30, 40, 50, 60 × 1021 cm−2. The white contour indicates the smoothed AV = 3 mag level. Additionally, the Class1 (“×”) and Class2 (“+”) YSOs are marked in white.
Current usage metrics show cumulative count of Article Views (full-text article views including HTML views, PDF and ePub downloads, according to the available data) and Abstracts Views on Vision4Press platform.
Data correspond to usage on the plateform after 2015. The current usage metrics is available 48-96 hours after online publication and is updated daily on week days.
Initial download of the metrics may take a while.