Fig. 4.
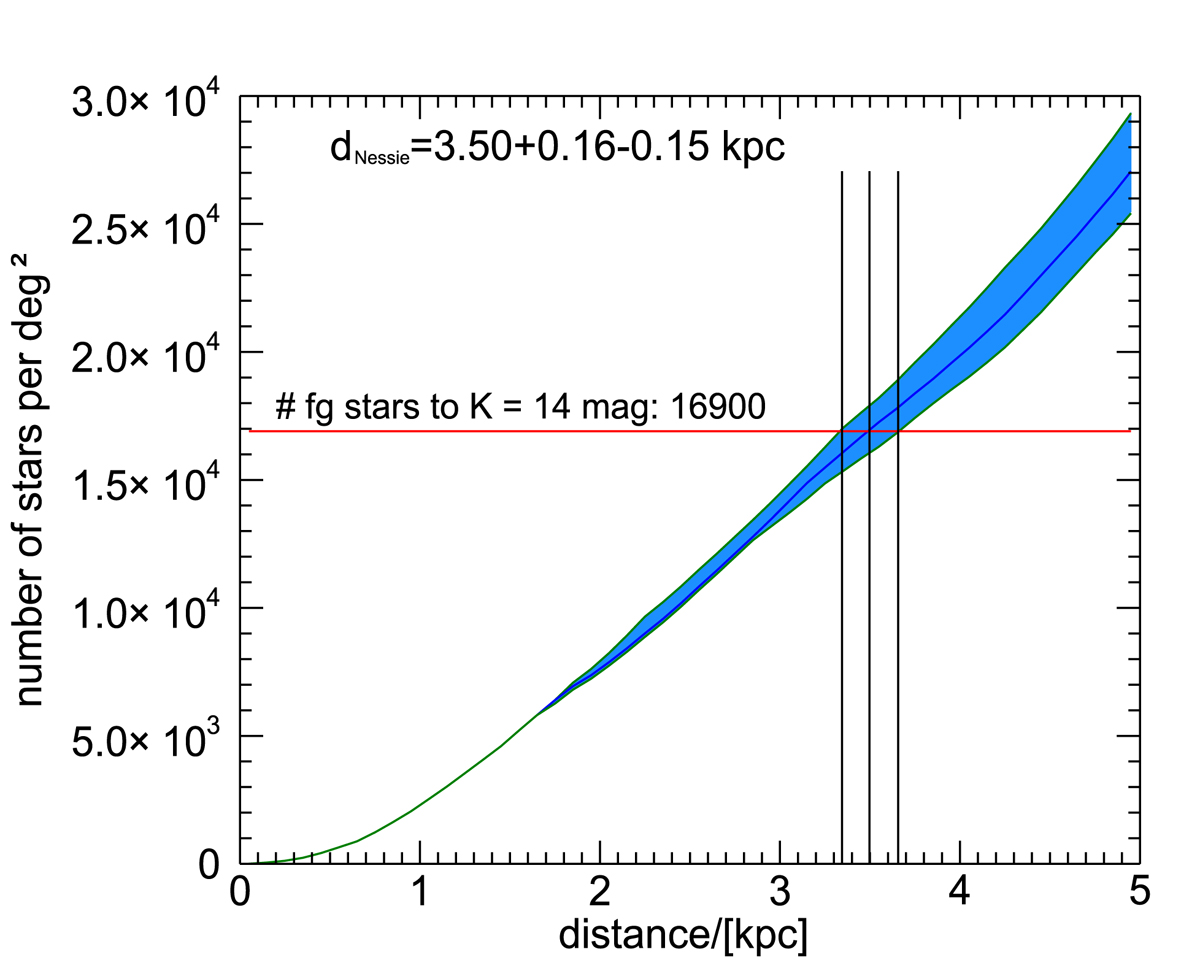
Predicted stellar surface density based on the Besançon stellar distribution model (Robin et al. 2003). The blue area indicates the uncertainty arising from the scatter in the diffuse extinction measurements. The horizontal line represents the measured foreground star surface density and the vertical lines the resulting estimates of the distance and its uncertainty.
Current usage metrics show cumulative count of Article Views (full-text article views including HTML views, PDF and ePub downloads, according to the available data) and Abstracts Views on Vision4Press platform.
Data correspond to usage on the plateform after 2015. The current usage metrics is available 48-96 hours after online publication and is updated daily on week days.
Initial download of the metrics may take a while.