Fig. 3.
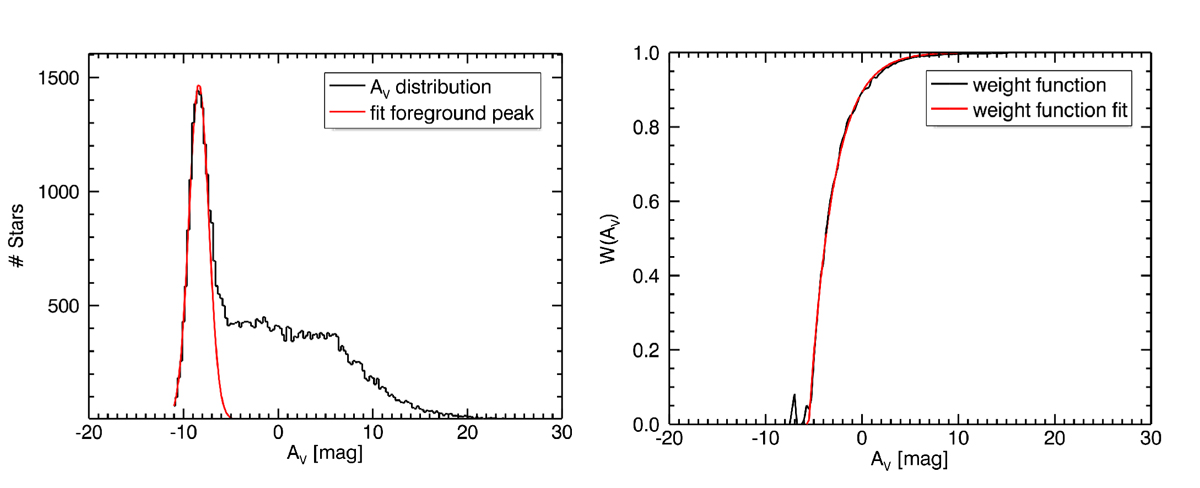
Left: the black line shows a histogram of the calculated extinction from a high-extinction region. The red line marks the Gaussian fitted to the peak of foreground stars. Right: the black line shows the empirical weighting function, which is derived as shown in Eq. (3). The red line shows the fitted function, which is then introduced into the weighting function of the NICER method (Eq. (4)).
Current usage metrics show cumulative count of Article Views (full-text article views including HTML views, PDF and ePub downloads, according to the available data) and Abstracts Views on Vision4Press platform.
Data correspond to usage on the plateform after 2015. The current usage metrics is available 48-96 hours after online publication and is updated daily on week days.
Initial download of the metrics may take a while.