Fig. 2.
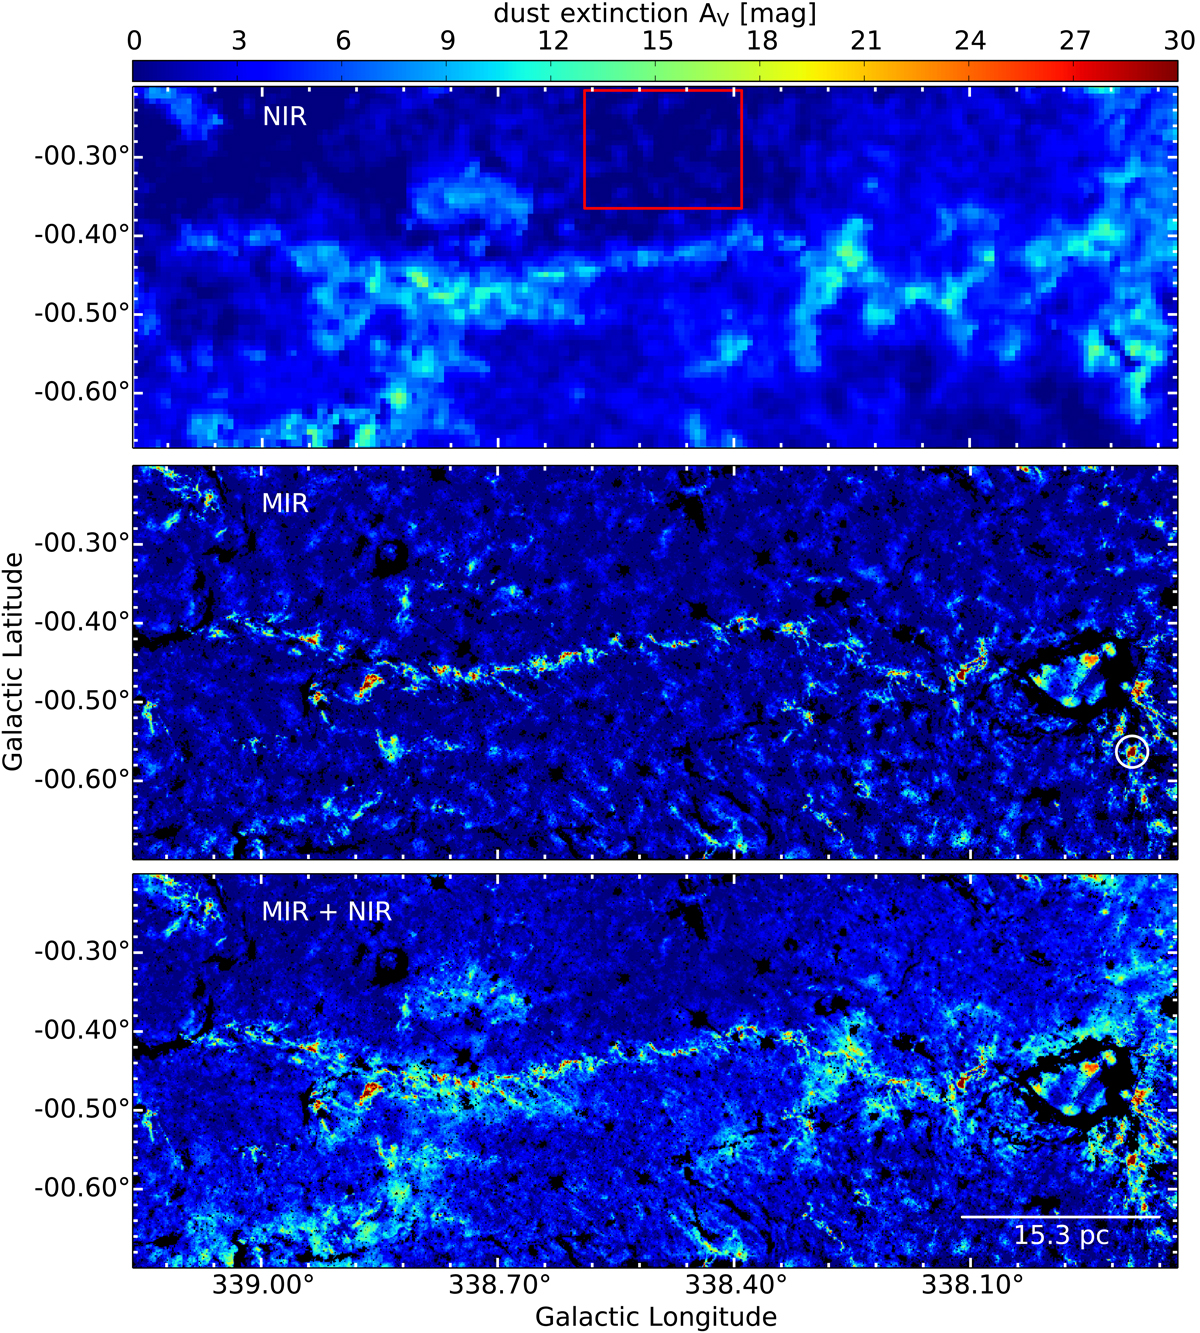
Extinction maps of Nessie derived using the NIR data of the VVV survey (top), MIR data of the Spitzer Space Telescope (center) and their combination (bottom). The black areas indicate regions of bright MIR emission that hampers extinction mapping. The red rectangle marks the area used for estimating the reference colors for the NICER method. The white circle marks the high-extinction region used to estimate the MIR foreground emission.
Current usage metrics show cumulative count of Article Views (full-text article views including HTML views, PDF and ePub downloads, according to the available data) and Abstracts Views on Vision4Press platform.
Data correspond to usage on the plateform after 2015. The current usage metrics is available 48-96 hours after online publication and is updated daily on week days.
Initial download of the metrics may take a while.