Fig. 12.
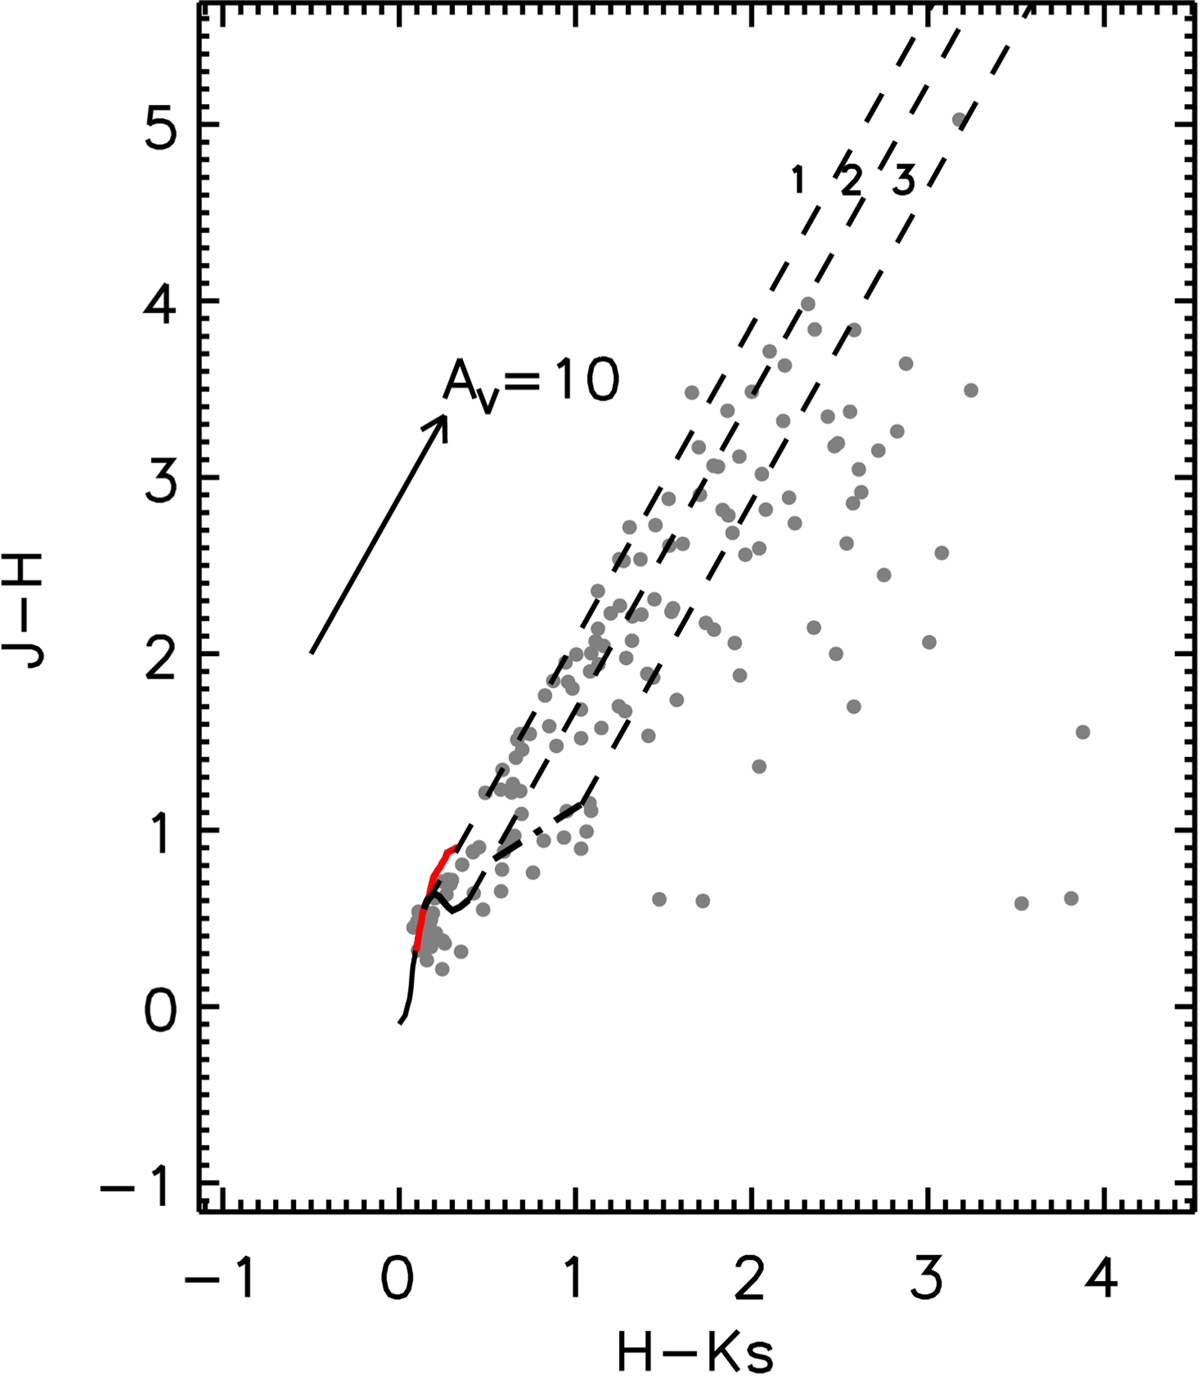
The H–KS vs. J–H color–color diagram for the YSO candidates in Nessie. The solid curves show the intrinsic colors for the main sequence stars (black) and giants (red; Bessell & Brett 1998), and the dash–dotted line is the locus of T Tauri stars from Meyer et al. (1997). The dashed lines show the reddening direction, and the arrow shows the reddening vector. The extinction law we adopted is from Xue et al. (2016). We note that the dashed lines separate the diagram into three regions marked with numbers 1, 2, and 3 in the figure. We use different methods to estimate the extinction of YSO candidates in different regions (see the text for details).
Current usage metrics show cumulative count of Article Views (full-text article views including HTML views, PDF and ePub downloads, according to the available data) and Abstracts Views on Vision4Press platform.
Data correspond to usage on the plateform after 2015. The current usage metrics is available 48-96 hours after online publication and is updated daily on week days.
Initial download of the metrics may take a while.