Fig. 10.
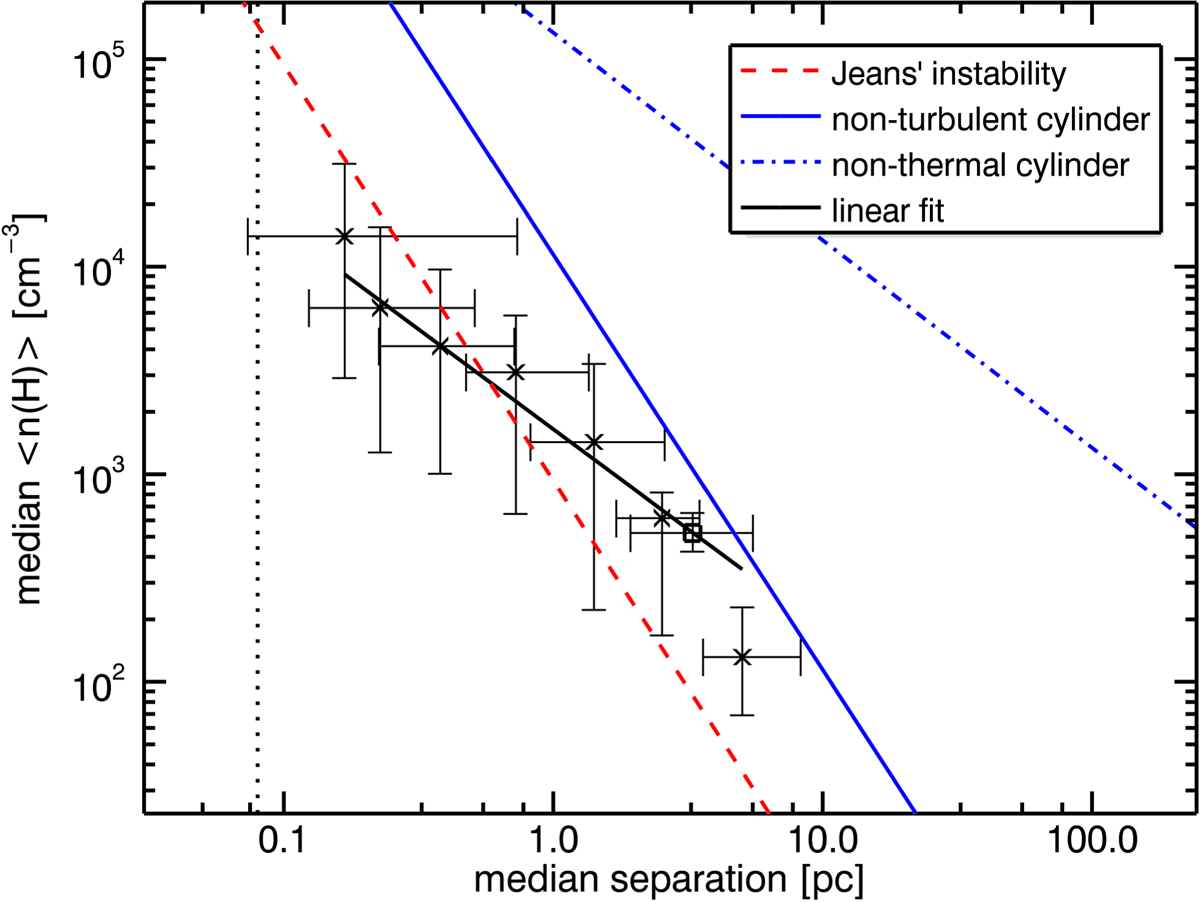
Median number density of structures at different spatial scales as a function of their median separation. Measurements of this study are marked with crosses. The square marks the data point derived from HNC observations of Jackson et al. (2010). The error bars show the 95% quantiles of both measurements. The blue lines indicate the scale dependency of an infinitely long cylinder in the non-turbulent case (solid), and non-thermal case (dash-dotted), and the dashed red line indicates the scale dependency of Jeans’ fragmentation. The black line shows a power-law fit to the data.
Current usage metrics show cumulative count of Article Views (full-text article views including HTML views, PDF and ePub downloads, according to the available data) and Abstracts Views on Vision4Press platform.
Data correspond to usage on the plateform after 2015. The current usage metrics is available 48-96 hours after online publication and is updated daily on week days.
Initial download of the metrics may take a while.