Fig. 5.
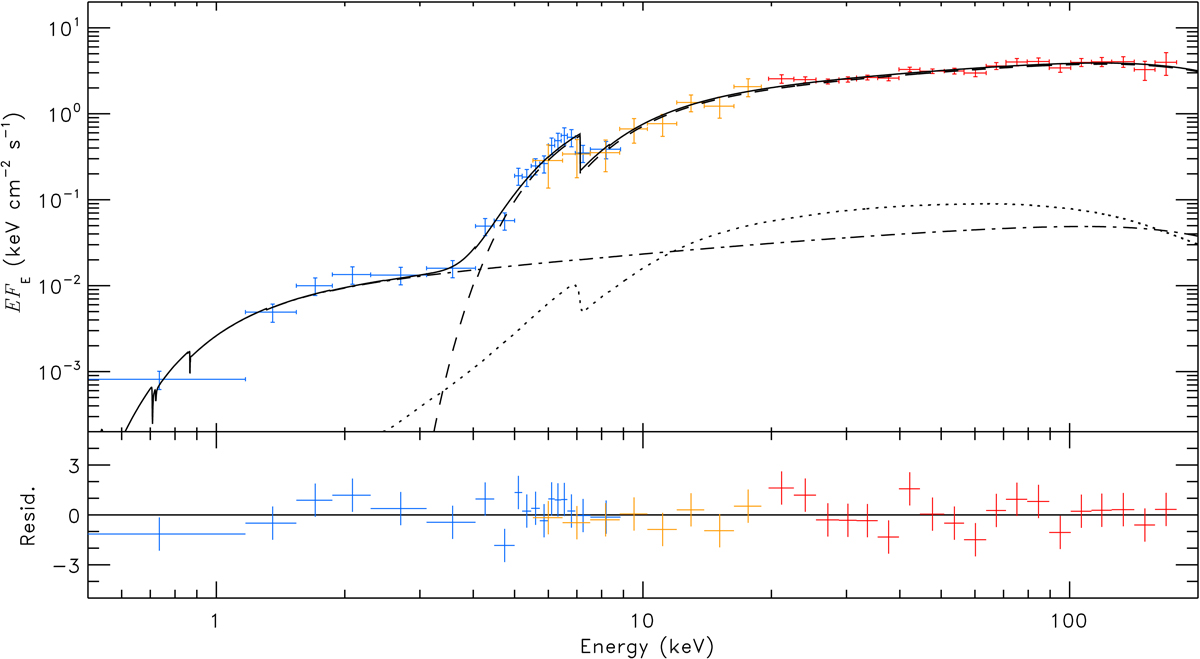
Broad-band spectrum of V404 Cyg of a simultaneous Swift/XRT (blue), INTEGRAL JEM-X (orange), and ISGRI (red) observation during an X-ray flare JF2d (see Fig. 3). The spectrum can be described by a partially covered Comptonized continuum or, as shown here, by the mytorus model (Yaqoob 2012), which describes a thick toroidal reprocessor that scatters the emission of a point-like X-ray source located at the geometrical centre of the torus. The spectral component dominating at high energies is produced by the emission transmitted through a column of NH ≈ 1 × 1024 cm−2 (dashed line). The dot-dashed line marks the direct Comptonization emission from the source, while the dotted line represents the emission scattered within the toroidal reprocessor before reaching the observer.
Current usage metrics show cumulative count of Article Views (full-text article views including HTML views, PDF and ePub downloads, according to the available data) and Abstracts Views on Vision4Press platform.
Data correspond to usage on the plateform after 2015. The current usage metrics is available 48-96 hours after online publication and is updated daily on week days.
Initial download of the metrics may take a while.