Fig. 4.
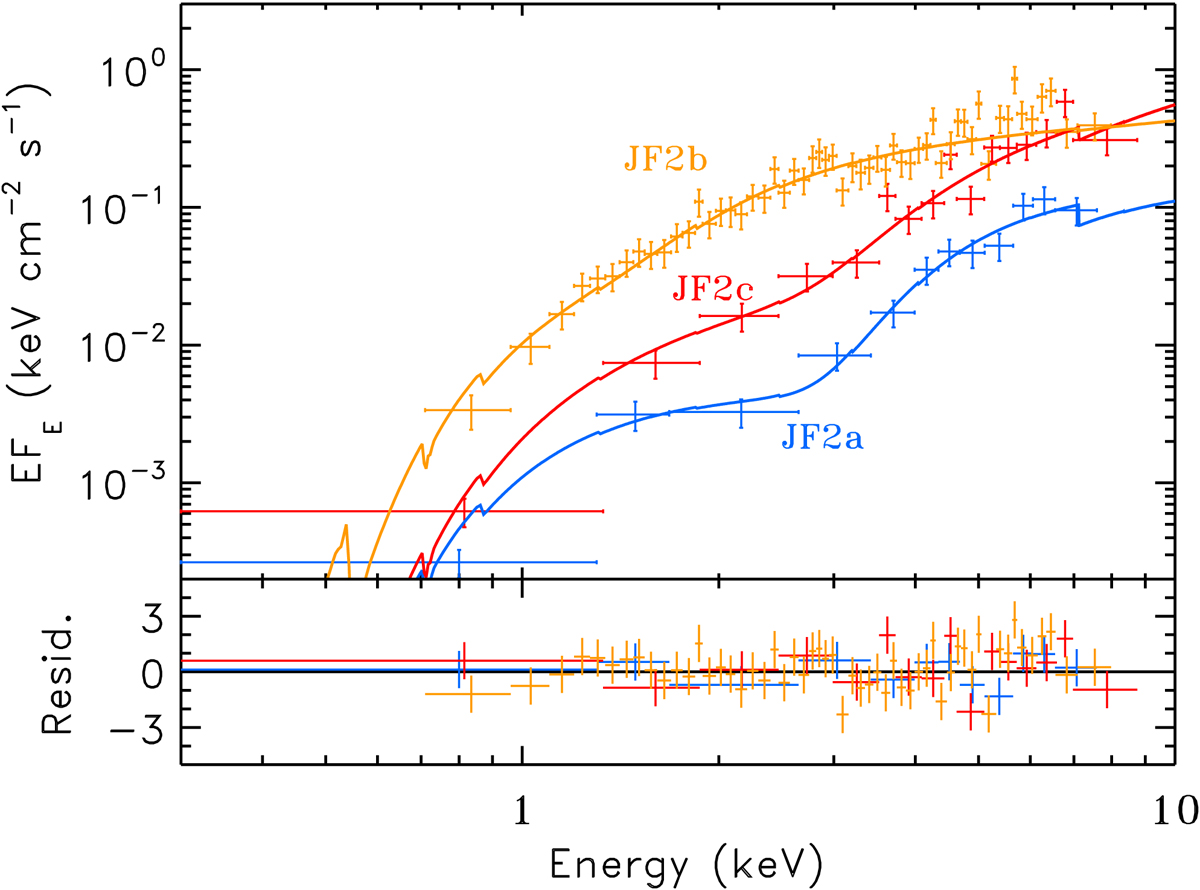
Rapid spectral changes seen during a Swift snapshot taken on 1 January 2016 (OBS ID: 00031403134). The green spectrum was extracted during the first 590 s of the observation (JF2a), the orange spectrum is the WT mode segment covering the 120 s duration flare (JF2b), and the purple spectrum was taken during a 480 s segment posterior to the flare (JF2c). The variability can be nicely described by a rapid uncovering of the intrinsic emission. Similar variability was also seen in the June outburst (see Motta et al. 2017a, Fig. 3).
Current usage metrics show cumulative count of Article Views (full-text article views including HTML views, PDF and ePub downloads, according to the available data) and Abstracts Views on Vision4Press platform.
Data correspond to usage on the plateform after 2015. The current usage metrics is available 48-96 hours after online publication and is updated daily on week days.
Initial download of the metrics may take a while.