Fig. 3.
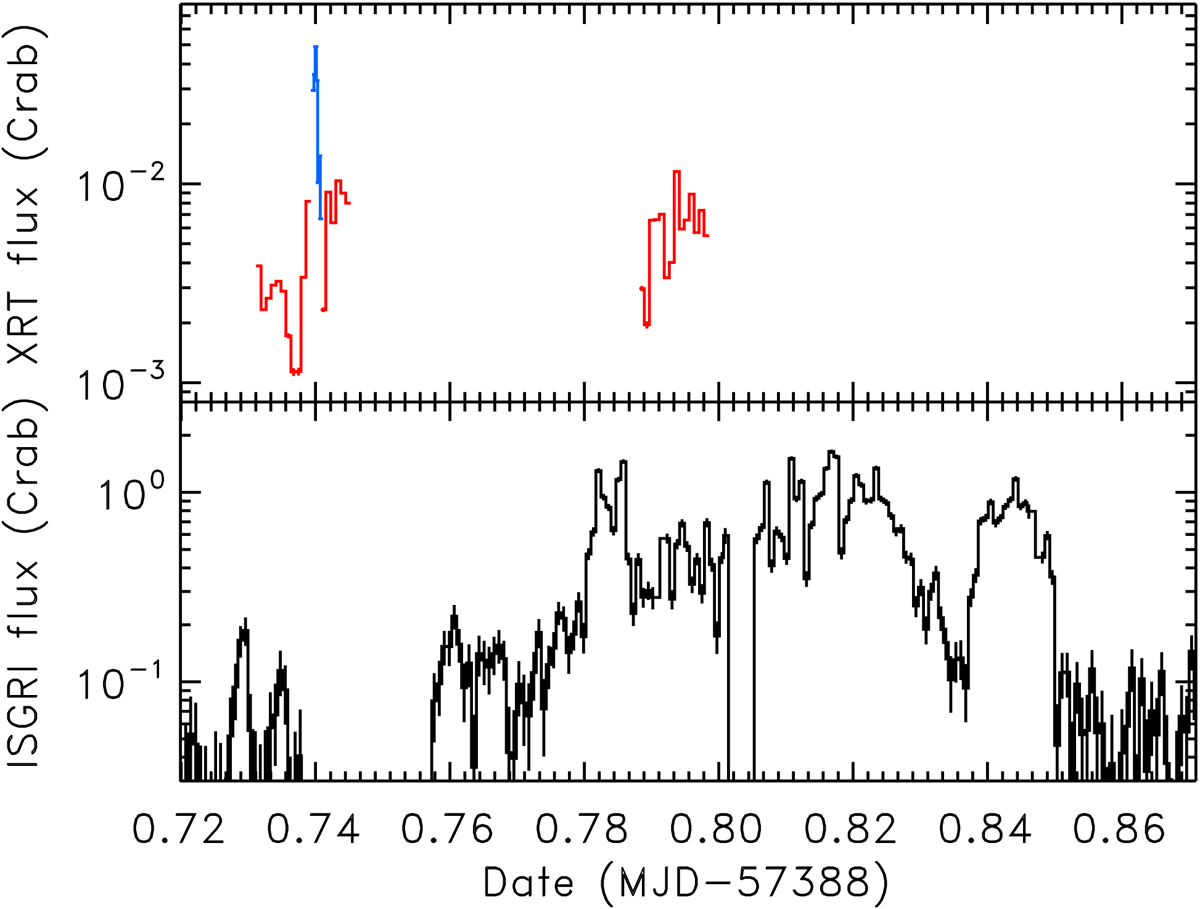
Swift/XRT (top) and INTEGRAL/ISGRI (bottom) light curves of a flare during MJD 57388.72–57388.87 (Obs. ID 00031403134 from 1 January 2016). The XRT PC mode data is shown in red and the WT data in blue. Spectral changes during the first XRT snapshot are shown in Fig. 4 and the broad-band spectrum with INTEGRAL and the second Swift snapshot is shown in Fig. 5. The ISGRI-only flare extraction (FX) times tabulated in Table 3 are denoted with horizontal lines.
Current usage metrics show cumulative count of Article Views (full-text article views including HTML views, PDF and ePub downloads, according to the available data) and Abstracts Views on Vision4Press platform.
Data correspond to usage on the plateform after 2015. The current usage metrics is available 48-96 hours after online publication and is updated daily on week days.
Initial download of the metrics may take a while.