Fig. 1.
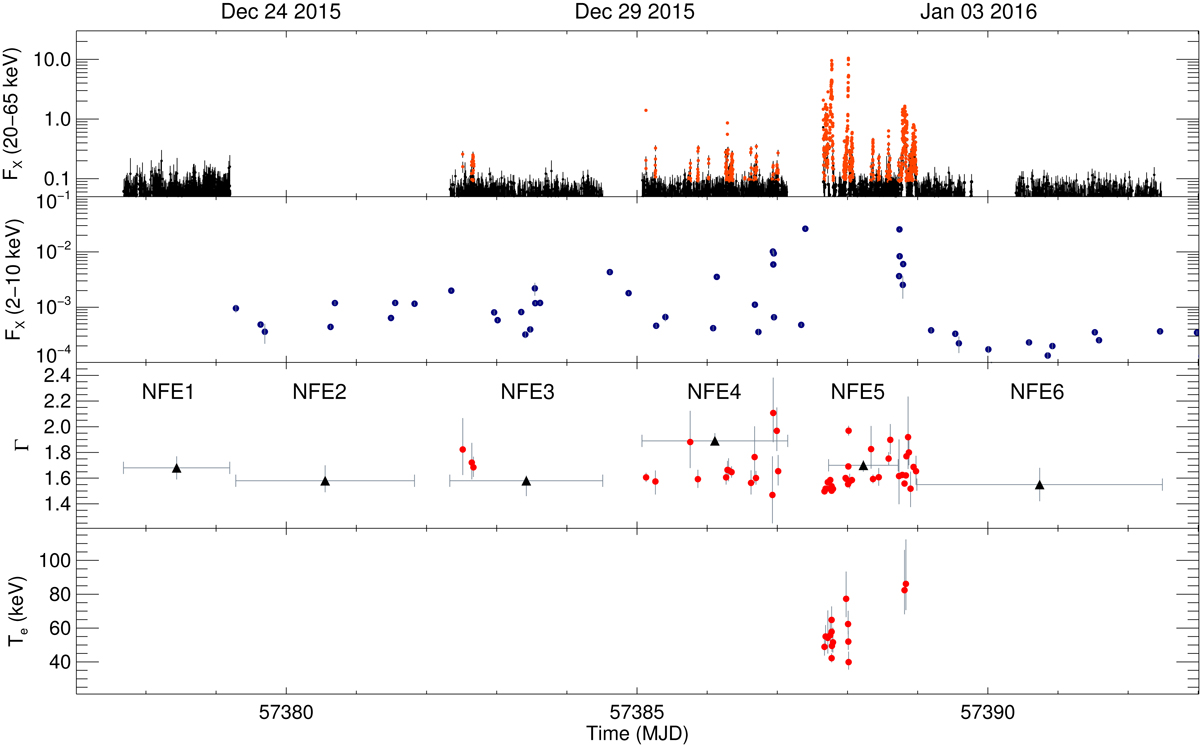
Light curve and spectral parameter evolution of V404 Cyg during the December 2015 outburst. Top panel: 20–65 keV INTEGRAL/ISGRI light curve, scaled to Crab units. Red symbols are used for the flares. Second panel: 2–10 keV fluxes (in Crab units) from the individual Swift/XRT snapshots. Blue circles indicate data used to extract the non-flaring spectra. Third panel: photon index; the black symbols indicate the spectra accumulated by averaging the Swift and INTEGRAL non-flaring emission. Bottom panel: electron temperatures from the NTHCOMP model fits.
Current usage metrics show cumulative count of Article Views (full-text article views including HTML views, PDF and ePub downloads, according to the available data) and Abstracts Views on Vision4Press platform.
Data correspond to usage on the plateform after 2015. The current usage metrics is available 48-96 hours after online publication and is updated daily on week days.
Initial download of the metrics may take a while.