Free Access
Fig. A.1
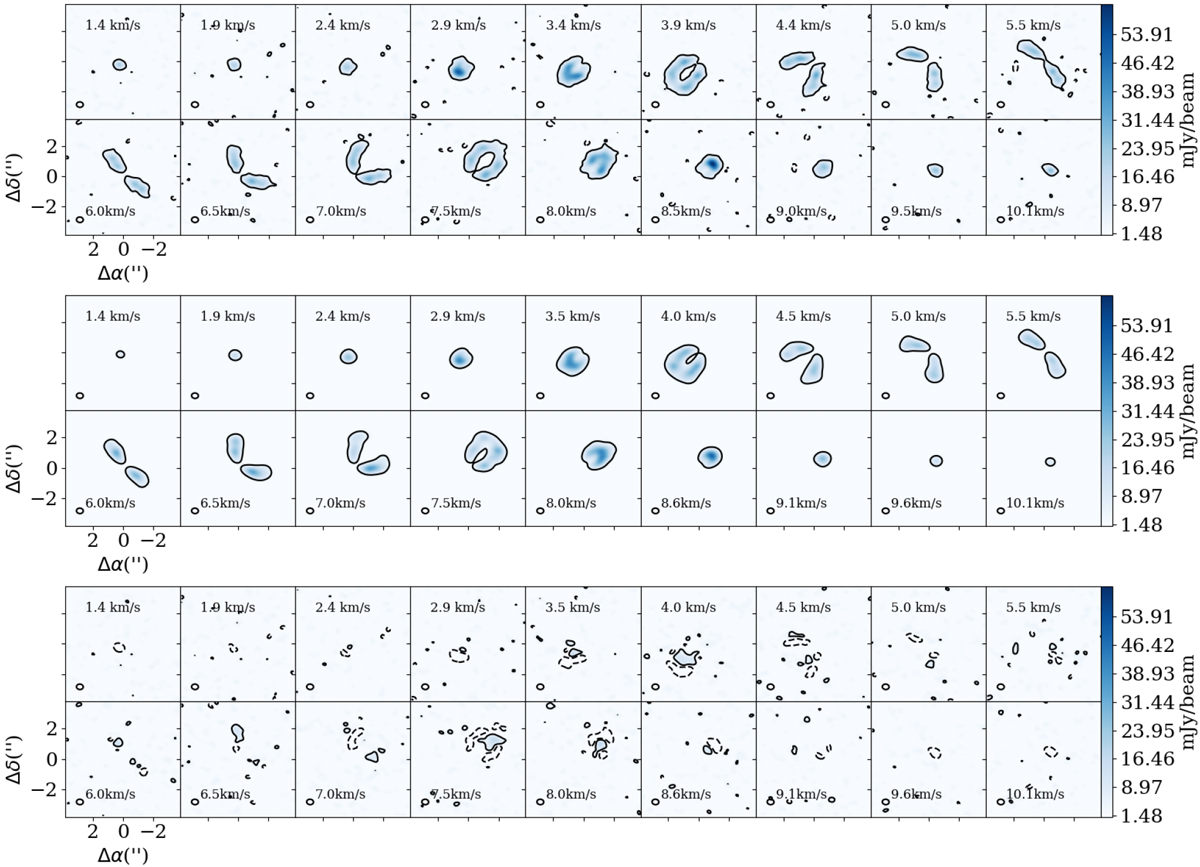
Toppanel: DCO+ J = 3–2 data channel maps. Middle panel: CD+WD+TI model. Bottom panel: residual channels. Contours are 3σ, where σ corresponds to the standard deviation of a line free channel. The channel maps presented here are binned in velocity to enhance S/N.
Current usage metrics show cumulative count of Article Views (full-text article views including HTML views, PDF and ePub downloads, according to the available data) and Abstracts Views on Vision4Press platform.
Data correspond to usage on the plateform after 2015. The current usage metrics is available 48-96 hours after online publication and is updated daily on week days.
Initial download of the metrics may take a while.