Fig. 3
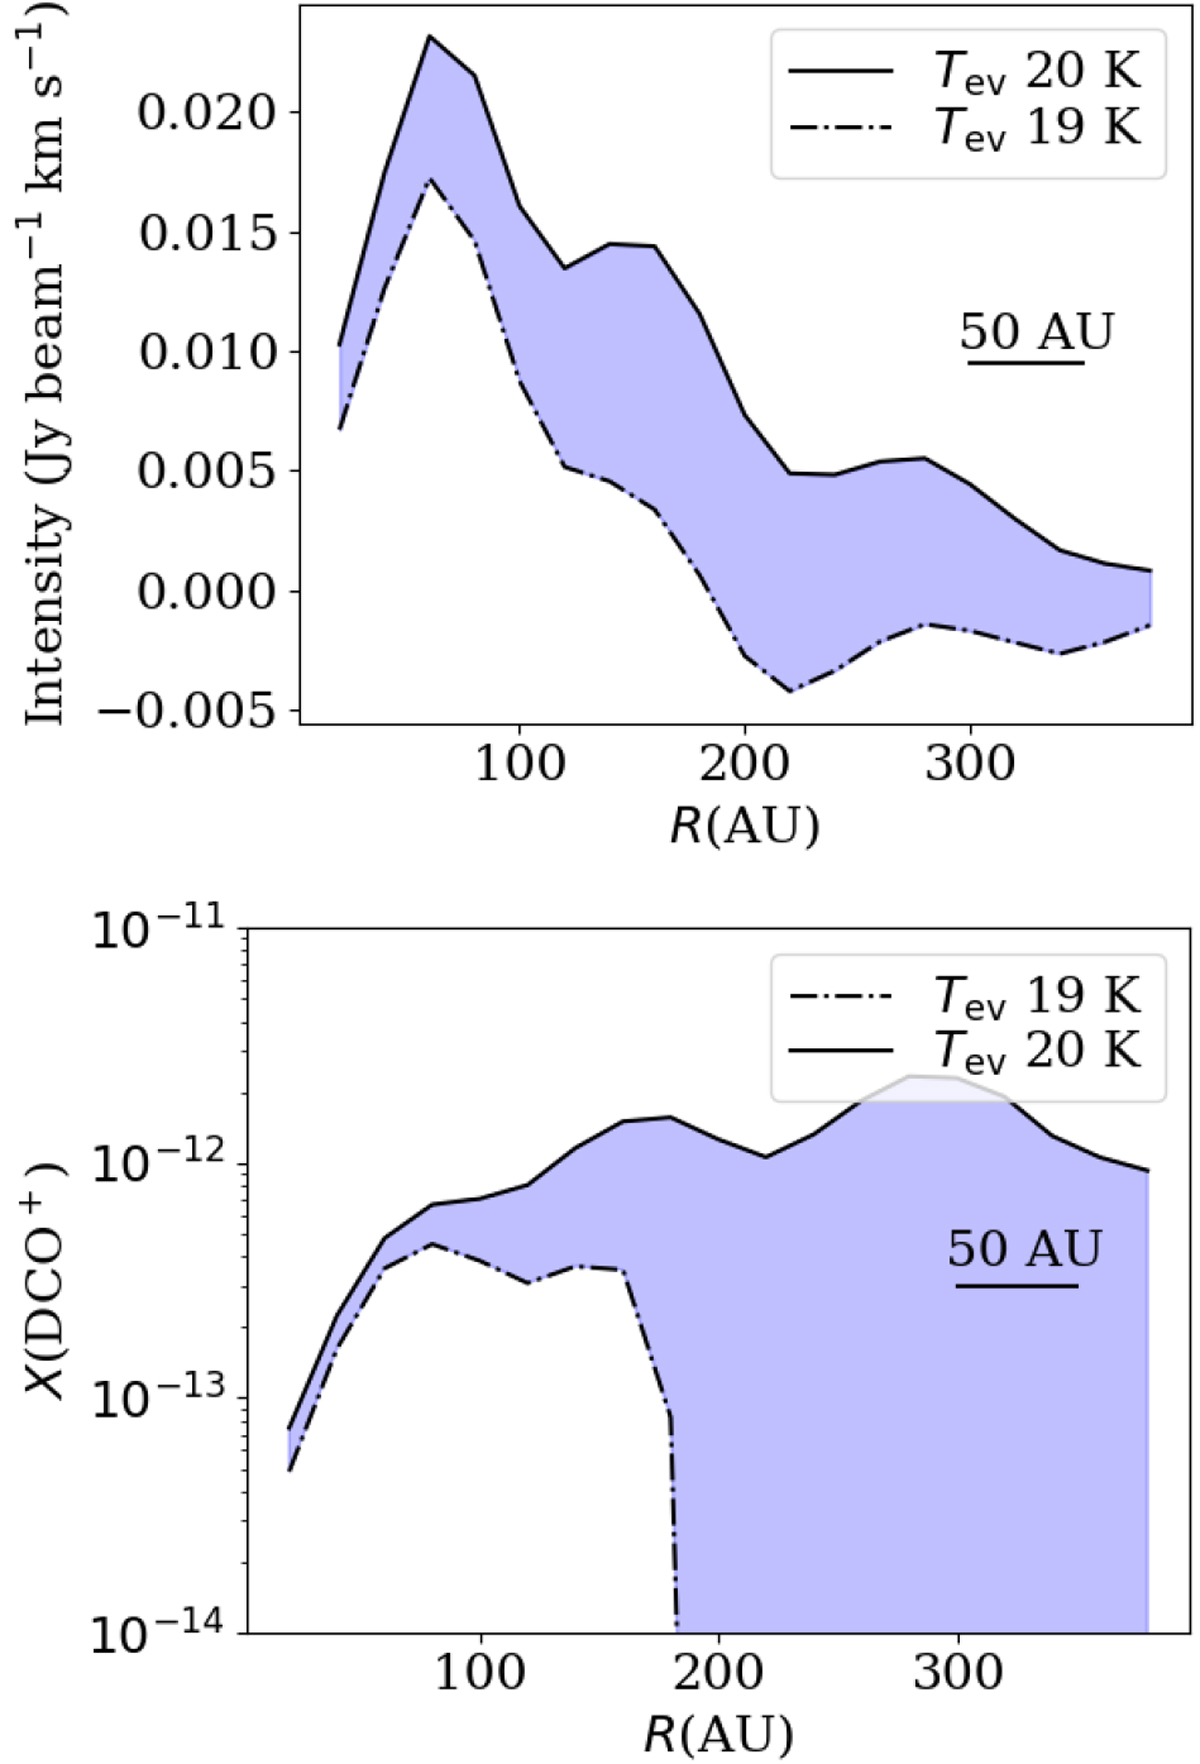
Top panel: residual radial profiles from the models in Fig. 1 with an evaporation temperature of CO TCO = 19–20 K and a constant abundance Xin = 5.0 × 10⁻⁵. Bottom panel: vertically averaged abundance estimate of the radial curves of the top panel using the same excitation temperatureprofile and prescription proposed by Salinas et al. (2017) to convert emission to column densities. The 50 AU bar corresponds to the semiminor axis of the synthesized beam and serves as a measure of the spatial resolution.
Current usage metrics show cumulative count of Article Views (full-text article views including HTML views, PDF and ePub downloads, according to the available data) and Abstracts Views on Vision4Press platform.
Data correspond to usage on the plateform after 2015. The current usage metrics is available 48-96 hours after online publication and is updated daily on week days.
Initial download of the metrics may take a while.