Fig. 7
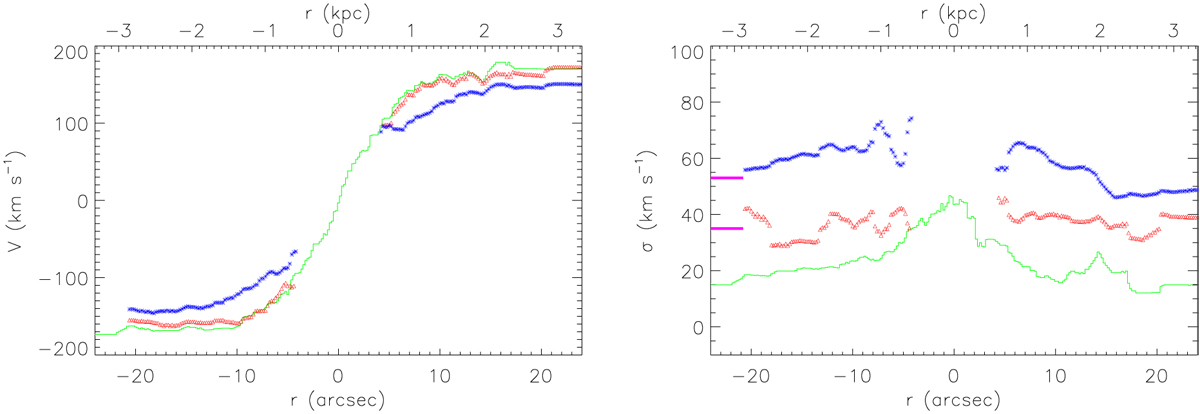
Velocity (left panel) and velocity dispersion curve (right panel) extracted along the major axis of IC 719. Blue, red, and green lines represent the main stellar component, secondary stellar component, and ionized gas, respectively. The velocity of the main component has been changed in sign in order to allow a direct comparison with the velocity of the other two components. The instrumental velocity dispersion of 35 km s−1 (CaT) and 53 km s−1 (Hα ) is indicated as reference by a horizontal tick. The extraction of the kinematics along the major axis has been doneby spatial averaging the spaxels in Figs. 5 and 6 considering a 2′′ -wide aperture passing thought the center along PA = 53°. Typical error-bars on the velocity and velocity dispersion are 5 and 10 km s−1, respectively.
Current usage metrics show cumulative count of Article Views (full-text article views including HTML views, PDF and ePub downloads, according to the available data) and Abstracts Views on Vision4Press platform.
Data correspond to usage on the plateform after 2015. The current usage metrics is available 48-96 hours after online publication and is updated daily on week days.
Initial download of the metrics may take a while.