Fig. 2
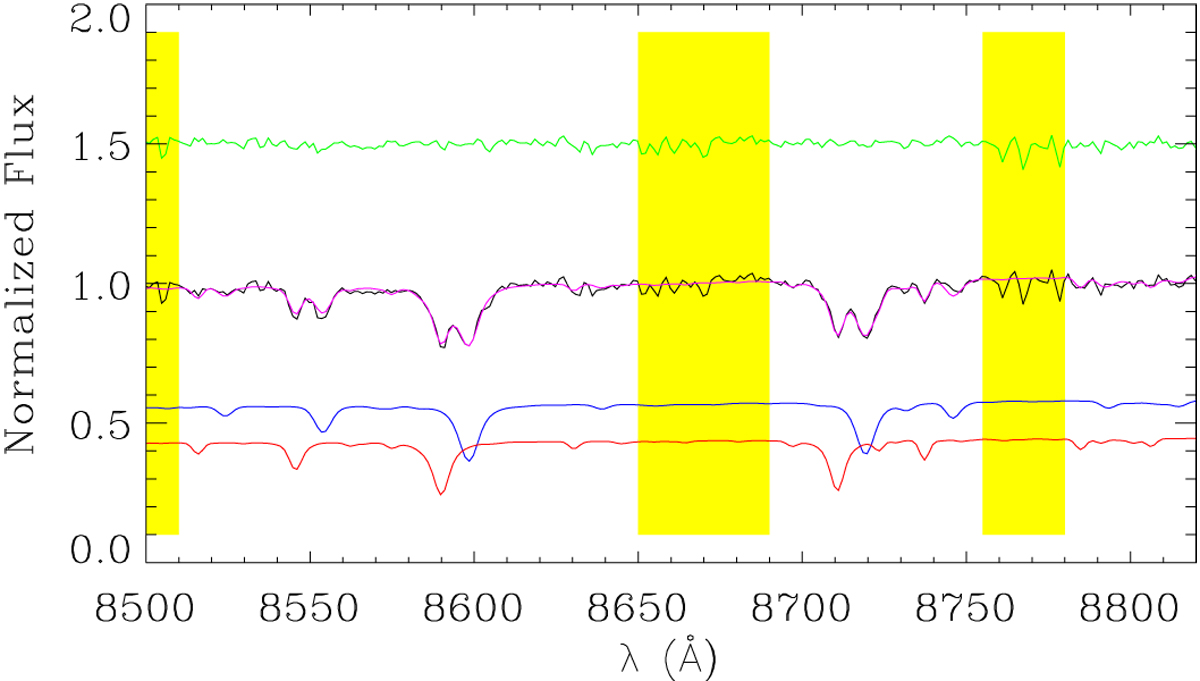
Example of the observed (black line) and fitted spectrum in a bin where the two stellar components appear separated. Here the fit is limited to the CaT wavelength region. We show the two stellar spectra fitted to the data (blue and red lines), and their sum (magenta line). The green line represents the residuals shifted upward by 1.5 units. The yellow regions are regions masked and not included in the fit.
Current usage metrics show cumulative count of Article Views (full-text article views including HTML views, PDF and ePub downloads, according to the available data) and Abstracts Views on Vision4Press platform.
Data correspond to usage on the plateform after 2015. The current usage metrics is available 48-96 hours after online publication and is updated daily on week days.
Initial download of the metrics may take a while.