Free Access
Fig. 19
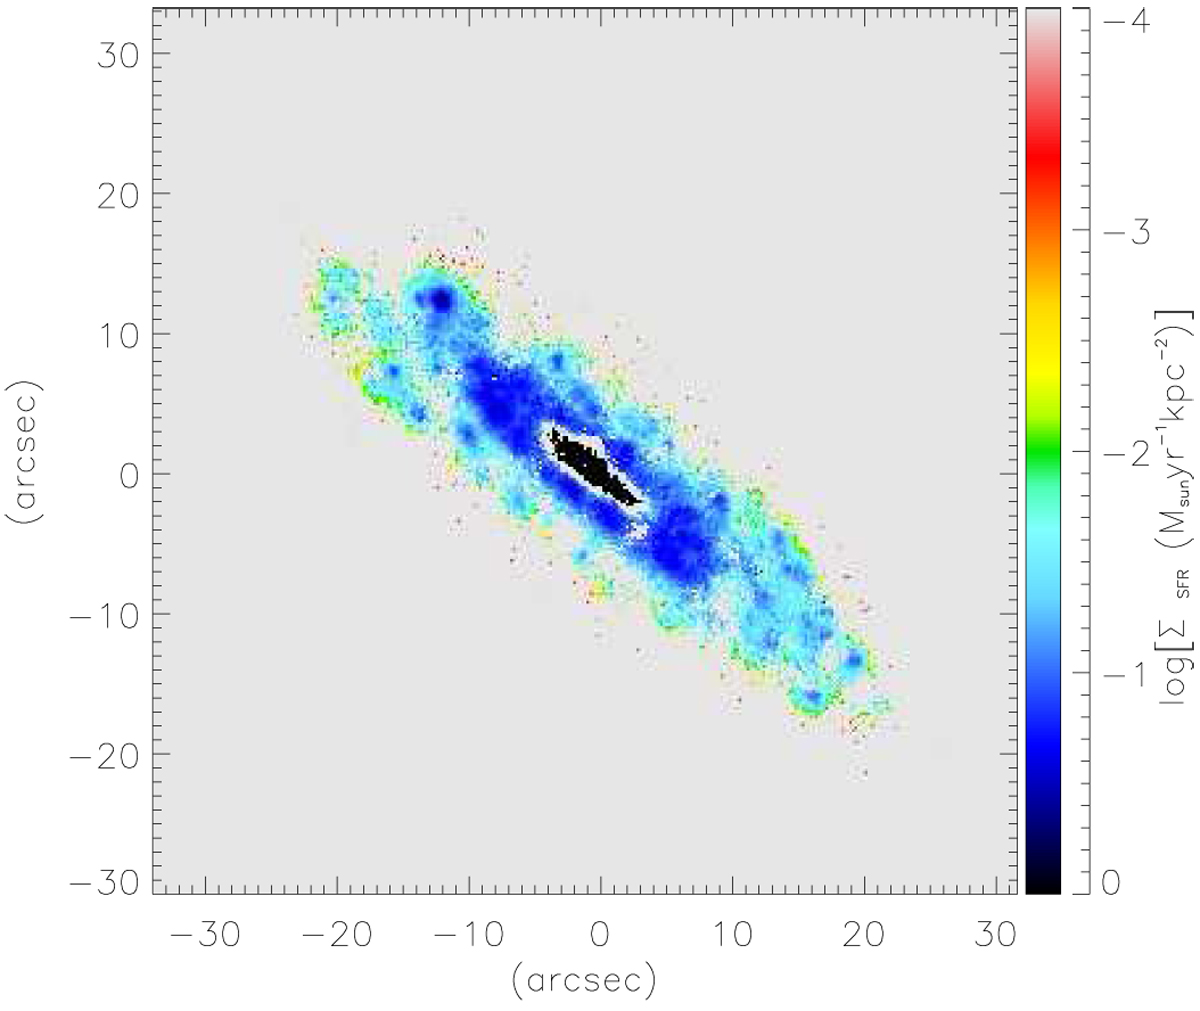
Color-coded SFR surface density map of IC 719. Black dots indicate the region where the BPT diagnostic indicates emission dominated by shocks. The gray region indicates where the signal was too low.
Current usage metrics show cumulative count of Article Views (full-text article views including HTML views, PDF and ePub downloads, according to the available data) and Abstracts Views on Vision4Press platform.
Data correspond to usage on the plateform after 2015. The current usage metrics is available 48-96 hours after online publication and is updated daily on week days.
Initial download of the metrics may take a while.